

Influence of intensive diabetes treatment on body weight and composition of adults with type 1 diabetes in the Diabetes Control and Complications Trial
- PMID: 11574431
- PMCID: PMC2663516
- DOI: 10.2337/diacare.24.10.1711
Influence of intensive diabetes treatment on body weight and composition of adults with type 1 diabetes in the Diabetes Control and Complications Trial
Abstract
Objective: To examine the differential effects of intensive and conventional diabetes therapy on weight gain and body composition in adults with type 1 diabetes.
Research design and methods: Between 1982 and 1989, 1,246 adults (aged 18-39 years) in the Diabetes Control and Complications Trial were randomly assigned to either conventional therapy (1-2 injections of insulin per day) or intensive therapy (multiple daily injections or continuous subcutaneous infusion with frequent blood-glucose testing). Height and weight were measured at baseline and at annual visits for an average of 6 years (range 3-9). Body composition was assessed cross-sectionally with bioelectrical impedance analysis during 1992, at which time waist and hip circumferences were measured.
Results: Intensively treated patients gained an average of 4.75 kg more than their conventionally treated counterparts (P < 0.0001). This represented excess increases in BMI of 1.5 kg/m(2) among men and 1.8 kg/m(2) among women. Growth-curve analysis showed that weight gain was most rapid during the first year of therapy. Intensive therapy patients were also more likely to become overweight (BMI >or=27.8 kg/m(2) for men, >or=27.3 kg/m(2) for women) or experience major weight gain (BMI increased >or=5 kg/m(2)). Waist-to-hip ratios, however, did not differ between treatment groups. Major weight gain was associated with higher percentages of body fat and greater fat-free mass, but among patients without major weight gain, those receiving intensive therapy had greater fat-free mass with no difference in adiposity.
Conclusions: Intensive therapy for type 1 diabetes produces substantial excess weight gain compared with conventional therapy. However, the additional weight appears to include lean tissue as well as fat.
Figures
 ) and conventional treatment patients (
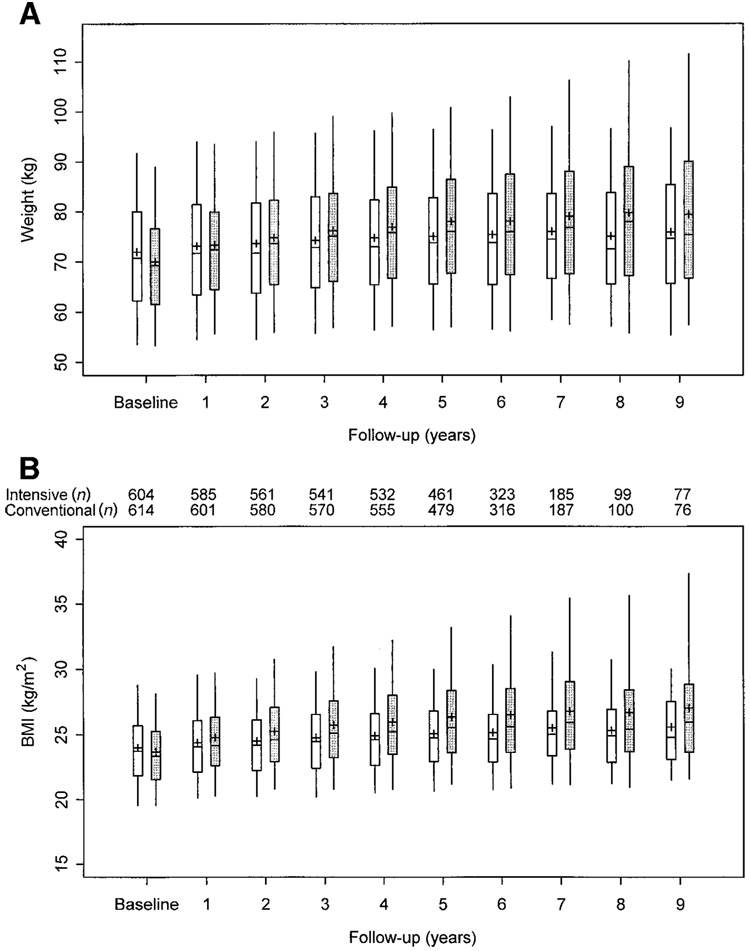
 ). The central line is the median, the upper and lower boxes represent the upper and lower quartiles, respectively, and the upper and lower vertical lines represent the 95th and 5th percentiles, respectively. The differences between the treatment groups in both measures are significant beginning at year 1 (P < 0.0001). The number of adult subjects in the intensive and conventional treatment groups at each year is noted between A and B.
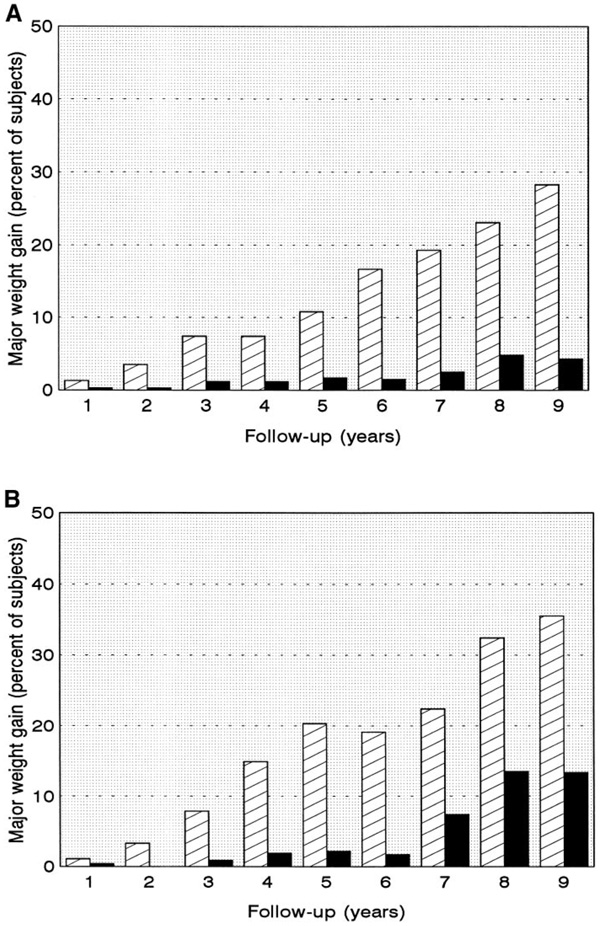
 ) and conventional (
 ) treatment groups. Differences between treatment groups were significant (P < 0.01) among men at all years after year 1, and at years 2–7 they were inclusive among women. The overall pattern of differences over time was significant at P < 0.01 in both sexes.
References
-
- The DCCT Research Group. Weight gain associated with intensive therapy in the Diabetes Control and Complications Trial. Diabetes Care. 1988;11:567–573. - PubMed
-
- The Diabetes Control and Complications Trial Research Group. The effect of intensive treatment of diabetes on the development and progression of long-term complications in insulin-dependent diabetes mellitus. NEJM. 1993;329:977–986. - PubMed
-
- The DCCT Research Group. The Diabetes Control and Complications Trial (DCCT): design and methodologic considerations for the feasibility phase. Diabetes. 1986;35:530–545. - PubMed
-
- The DCCT Research Group. Feasibility of centralized measurements of glycated hemoglobin in the Diabetes Control and Complications Trial: a multicenter center. Clin Chem. 1987;33:2267–2271. - PubMed
-
- Metropolitan Life Foundation. 1983 Metropolitan height and weight tables. Stat Bull Metrop Life Found. 1983;64:2–9. - PubMed
Publication types
MeSH terms
Substances
Grants and funding
LinkOut - more resources
Full Text Sources
Other Literature Sources
Medical
