. 2001 Oct 1;194(7):1003-12.
doi: 10.1084/jem.194.7.1003.

Notch 1-deficient common lymphoid precursors adopt a B cell fate in the thymus

Affiliations

Notch 1-deficient common lymphoid precursors adopt a B cell fate in the thymus

A Wilson et al. J Exp Med. .

Abstract

We have recently reported that Notch 1, a member of the Notch multigene family, is essential for the development of murine T cells. Using a mouse model in which Notch 1 is inactivated in bone marrow (BM) precursors we have shown that B cells instead of T cells are found in the thymus of BM chimeras. However, it is not clear whether these B cells develop by default from a common lymphoid precursor due to the absence of Notch 1 signaling, or whether they arise as a result of perturbed migration of BM-derived B cells and/or altered homeostasis of normal resident thymic B cells. In this report we show that Notch 1-deficient thymic B cells resemble BM B cells in phenotype and turnover kinetics and are located predominantly in the medulla and corticomedullary junction. Peripheral blood lymphocyte analysis shows no evidence of recirculating Notch1(-/)- BM B cells. Furthermore, lack of T cell development is not due to a failure of Notch1(-/)- precursors to home to the thymus, as even after intrathymic reconstitution with BM cells, B cells instead of T cells develop from Notch 1-deficient precursors. Taken together, these results provide evidence for de novo ectopic B cell development in the thymus, and support the hypothesis that in the absence of Notch 1 common lymphoid precursors adopt the default cell fate and develop into B cells instead.


Figures

Figure 1
Figure 1
Kinetics of emergence of immature B cells in the adult thymus after Notch 1 deletion. (A) Total thymocyte numbers (×106) and the CD4 versus CD8 profiles (top row) of adult thymi from control (left panel), Notch 1 deleted at 7, 14, 21, and 28 d (respectively) after pIpC injection (middle panels), compared with the profile obtained from CD45.2+ cells derived from Notch 1–deficient BM in the mixed BM chimera system (right panel) after 3 mo. The relative percentage of DN thymocytes is shown for each time point as well as the CD19 versus B220 FACS® analysis on gated DNs (bottom row). Contour plots are representative examples of individual mice. Data are mean ± SD from 8–12 mice for each time point. (B) Expression of B220 versus IgM or CD43 on total BM and thymus from Notch 1–deficient mice 28 d after deletion. (C) Expression of B cell markers, IgM, IgD, Sca-1, AA4.1, BP-1, and CD25 on gated LN, BM, or thymic B cells (gated on B220+CD19+) in CD45.2+ Notch 1–deficient BM-derived cells from mixed BM chimeras compared with Notch 1–deficient thymic B cells in the adult deletion model.
Figure 1
Figure 1
Kinetics of emergence of immature B cells in the adult thymus after Notch 1 deletion. (A) Total thymocyte numbers (×106) and the CD4 versus CD8 profiles (top row) of adult thymi from control (left panel), Notch 1 deleted at 7, 14, 21, and 28 d (respectively) after pIpC injection (middle panels), compared with the profile obtained from CD45.2+ cells derived from Notch 1–deficient BM in the mixed BM chimera system (right panel) after 3 mo. The relative percentage of DN thymocytes is shown for each time point as well as the CD19 versus B220 FACS® analysis on gated DNs (bottom row). Contour plots are representative examples of individual mice. Data are mean ± SD from 8–12 mice for each time point. (B) Expression of B220 versus IgM or CD43 on total BM and thymus from Notch 1–deficient mice 28 d after deletion. (C) Expression of B cell markers, IgM, IgD, Sca-1, AA4.1, BP-1, and CD25 on gated LN, BM, or thymic B cells (gated on B220+CD19+) in CD45.2+ Notch 1–deficient BM-derived cells from mixed BM chimeras compared with Notch 1–deficient thymic B cells in the adult deletion model.
Figure 2
Figure 2
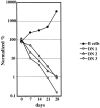
Concomitant increase in thymic B cells and decrease in DN 1, 2, or 3 immature thymocytes in adult Notch 1–deleted mice. Total numbers of thymic B cells or DN 1 (lineage negative, CD117+44+25), DN 2 (CD117+44+25+), and DN 3 (CD1174425+) thymocytes from Notch 1 adult deleted mice (at various times after deletion) were normalized to the equivalent subset from pIpC-treated control mice which was taken as 100%. Data are mean values of 8–12 mice per time point.
Figure 3
Figure 3
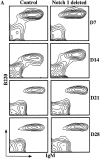
Mature phenotype of circulating B cells in Notch1−/− mice. (A) Expression of B220 versus IgM on PBLs isolated from pIpC-treated control or Notch 1–deficient mice on days 7, 14, 21, and 28 after deletion. (B) Expression of IgM, IgD, class II, AA4.1, BP-1, and CD43 on gated B220+CD19+ B cells isolated from PBLs from control (dotted line) compared with Notch 1 deleted (solid line) 21 d after deletion. Data for each part of Fig. 3 are representative FACS® profiles from experiments in which six mice of each genotype were analyzed at each time point.
Figure 3
Figure 3
Mature phenotype of circulating B cells in Notch1−/− mice. (A) Expression of B220 versus IgM on PBLs isolated from pIpC-treated control or Notch 1–deficient mice on days 7, 14, 21, and 28 after deletion. (B) Expression of IgM, IgD, class II, AA4.1, BP-1, and CD43 on gated B220+CD19+ B cells isolated from PBLs from control (dotted line) compared with Notch 1 deleted (solid line) 21 d after deletion. Data for each part of Fig. 3 are representative FACS® profiles from experiments in which six mice of each genotype were analyzed at each time point.
Figure 5
Figure 5
Notch1−/− BM cells give rise to B cells upon intrathymic injection. (A) Expression of CD45.2 (donor derived) versus CD45.1 (host derived) in the thymus 21 d after intrathymic injection of control (top panel) or Notch 1–deficient (bottom panel) BM. Contour plots contain around 500,000 events. (B) Expression of CD4 versus CD8 in CD45.2+ (donor derived) thymocytes 21 d after intrathymic injection of control (top) or Notch 1–deleted (bottom) BM. Contour plots contain around 10,000 and 5,000 events, respectively. (C) Expression of B220, CD19, and AA4.1 on CD45.2+CD4CD8 (donor derived) thymocytes 21 d after intrathymic injection of Notch 1–deleted BM. Data for all parts of Fig. 5 are representative stainings from three independent experiments.
Figure 4
Figure 4
Rapid turnover of Notch1−/− thymic B cells. Percentage of BrdU+ B cells (gated as B220+CD19+) from thymus, PBLs, spleen, and BM isolated from control (right panel) or Notch 1–deleted (14 d after deletion, left panel) mice after 12, 24, or 48 h continuous labeling. Data are mean ± SD of 4–8 mice per time point.
Figure 6
Figure 6
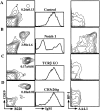
Comparison of thymic B cells in Notch1−/− versus other T cell–deficient mouse models. Number and phenotype of thymic B cells in (A) control, (B) day 28 adult Notch 1 deleted, (C) CD3ε26tg, and (D) TCRβ-deficient mice. CD19 versus B220 profiles on total thymus (left panels), expression of IgM (middle panels), and BP-1 versus AA4.1 (right panels) on gated B220+ B cells. The numbers are mean ± SD of total B cells (×106) per thymus from 7–10 mice of each genotype.
Figure 7
Figure 7
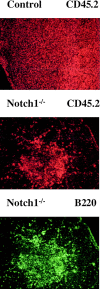
Tissue localization of intrathymic Notch1−/− B cells in mixed BM chimeras. Expression of CD45.2 (top two panels) and B220 (bottom panel) on serial sections of thymi reconstituted with control (top panel) or Notch 1 deleted (bottom panels) BM precursors.

Comment in

  • Coming to grips with Notch.
    von Boehmer H. von Boehmer H. J Exp Med. 2001 Oct 1;194(7):F43-6. doi: 10.1084/jem.194.7.f43. J Exp Med. 2001. PMID: 11581323 Free PMC article. No abstract available.

References

    1. Artavanis-Tsakonas S., Rand M.D., Lake R.J. Notch signalingcell fate control and signal integration in development. Science. 1999;284:770–776. - PubMed
    1. Artavanis-Tsakonas S., Matsuno K., Fortini M.E. Notch signaling. Science. 1995;268:225–232. - PubMed
    1. Shutter J.R., Scully S., Fan W., Richards W.G., Kitajewski J., Deblandre G.A., Kintner C.R., Stark K.L. Dll4, a novel Notch ligand expressed in arterial endothelium. Genes Dev. 2000;14:1313–1318. - PMC - PubMed
    1. Osborne B., Miele L. Notch and the immune system. Immunity. 1999;11:653–663. - PubMed
    1. Robey E. Regulation of T cell fate by Notch. Annu. Rev. Immunol. 1999;17:283–295. - PubMed

Publication types