

Review
doi: 10.1128/MCB.21.21.7117-7136.2001.
Structural and evolutionary relationships among protein tyrosine phosphatase domains
Affiliations
- PMID: 11585896
- PMCID: PMC99888
- DOI: 10.1128/MCB.21.21.7117-7136.2001
Item in Clipboard
Review
Structural and evolutionary relationships among protein tyrosine phosphatase domains
Mol Cell Biol.
2001 Nov.
No abstract available
Figures
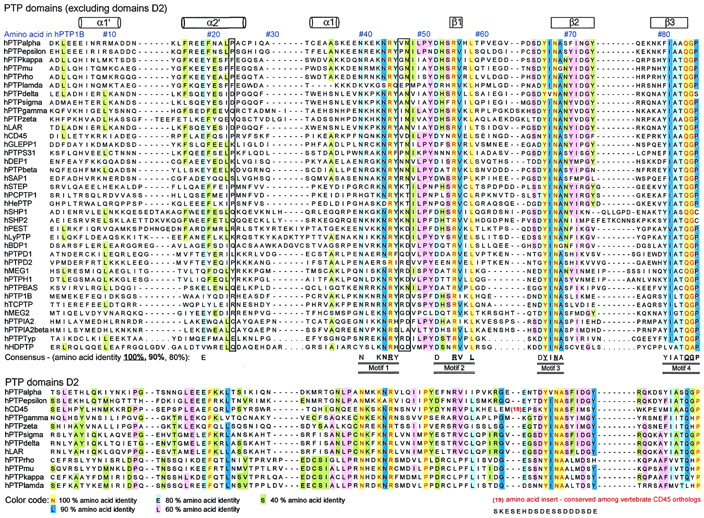
Sequence comparison of human PTP domains. Shown is an
amino acid sequence alignment of 37 human PTP domains (from
nontransmembrane PTP and RPTP domains D1) (above) and comparison with
domain D2 sequences of RPTPs (below). Amino acids are numbered
according to the residue position in human PTP1B. The locations of
α-helices and β-strands (based on the X-ray crystal structure of
PTP1B [7]) are shown at the top of the alignment.
Twenty-two invariant residues (underscored) and 42 highly conserved
residues (>80% identity) are indicated at the bottom of the
alignment. The PTP consensus motifs (M1 to M10) are detailed in Table
2. Amino acids are color coded according to their degree of
conservation, as indicated below the alignment. Nonconserved residues
involved in the definition of substrate selectivity-determining regions
are boxed with black lines (see text and Fig. 9). The four-residue
conserved linker in tandem RPTP enzymes is boxed in yellow (above) and
corresponds to encircled area 1 in Fig. 8. Sequences were aligned using
the Clustalw algorithm and the Genetics Computer Group PileUp software
(version 8.1) by applying the BLOSUM 62 scoring matrix together with
default gap creation and extension penalty. Alignment of the N termini
of the PTP domains was guided by crystallographic structural data and
secondary structure predictions (nnpredict at
http://www.cmpharm.ucsf.edu ). The complete alignment of all vertebrate
PTP domains can be retrieved (http://science.novonordisk.com/ptp )
in several standard GCG formats, including MSF, TFA, and ALN.
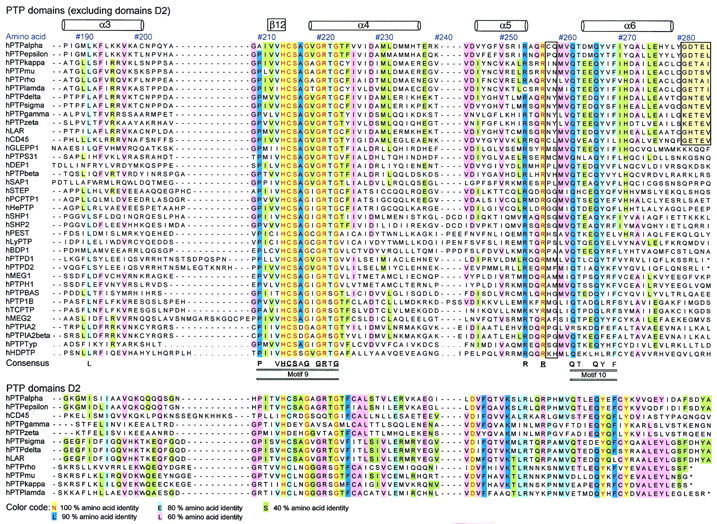

Classification of family of PTPs into 17 subtypes. Shown
is an unrooted tree derived from the alignment of 113 vertebrate PTP
domain sequences (residue positions 1 to 279 in human PTP1B). The tree
was drawn by the neighbor-joining method (73). The
horizontal distance indicates the degree of sequence divergence, and
the scale at the top corner represents the number of substitution
events (10 per 100 amino acids). Seventeen PTP domain subtypes were
identified from the phylogram: nine nontransmembrane subtypes (NT1 to
NT9), five tandem receptor-like subtypes (R1/R6, R2A, R2B, R4, and R5),
and three single-domain RPTP subtypes (R3, R7, and R8 [subtype R8 is
believed to be catalytically inactive]). As a statistical test of the
significance of sequence similarity within PTP subtypes, bootstrap
values were calculated (values are at the dendogram node). With the
exception of the RPTPβ-like subtype (R3) and the tandem PTP domain
supertype, all subdivisions were assigned based on maximal bootstrap
values (1,000). (A tree including the PTP domain D2 sequences can be
viewed [http://science.novonordisk.com/ptp ], and the raw data files
can also be retrieved in several standard GCG formats).

Schematic representation of PTP family members.
Determination of sequence similarity among PTP catalytic domains (Fig.
2) was used to classify the PTP family of enzymes into nine
nontransmembrane PTP subtypes (NT) and eight RPTP subtypes (R). Only
the human PTPs are listed, and a representative member of each subtype
is shown. Synonyms and classifications of all vertebrate PTPs are given
in Table 1. PTPs having closely related catalytic domains also tend to
be similar in overall structural topology.
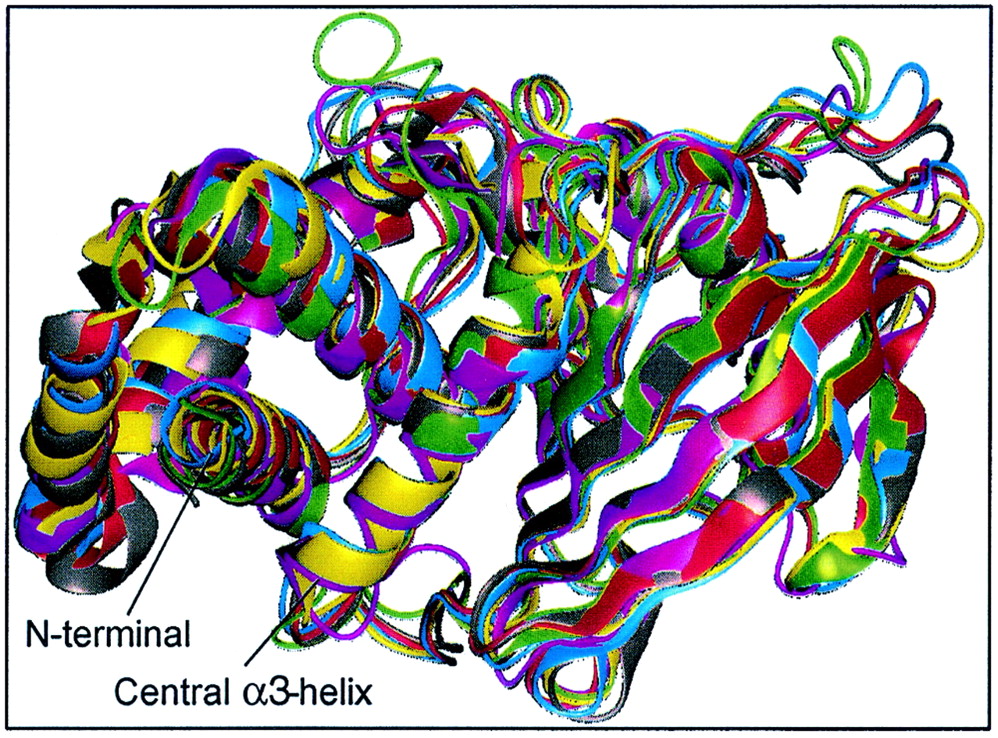
Crystal structures of vertebrate PTP domains show
conserved fold and consistent Cα-backbone trace. PTP1B (magenta),
RPTPα (gray), RPTPμ (red), LAR (blue), SHP1 (green), and SHP2
(yellow) were aligned and superimposed using Quanta (Molecular
Simulations Inc.). For clarity, residues 280 to 298 (C terminal) of
PTP1B, 250 to 281 (N terminal) and 522 to 532 (C terminal) of SHP1, and
2 to 218 (N terminal) of SHP2 were omitted from the figure, as well as
D2 of LAR. The calculated RMS deviations between all Cα atoms between
PTP1B and other PTPs are as follows: PTPα, 1.35 Å; RPTPμ,
2.72 Å; LAR D1, 2.78 Å; SHP1, 3.14 Å; and
SHP2, 2.74 Å. For comparison, the RMS deviation between
domains D1 and D2 of LAR is 1.3 Å. The X-ray structures are
compared in their native open conformation.
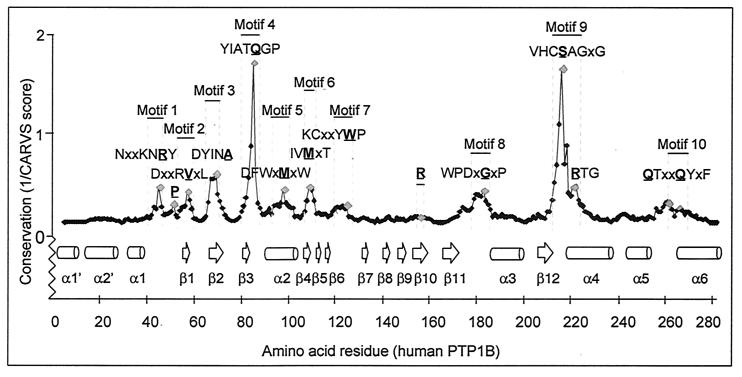
The HCSAGXGR and IAXQGP motifs reside within the most
highly conserved microenvironment of the PTP structure. Residues
located within a highly conserved three dimensional space of the PTP
structure are identified by peaks. The Cα-regiovariation score was
calculated using the alignment information in Fig. 1 and the tertiary
structure of PTP1B as template. Neighboring residues were defined using
a three-dimensional 7-Å sphere of influence. Similar results were
obtained for a 5- to 8-Å sphere and when using PTPα, PTPμ, or SHP2
as templates for Cα-regiovariation score analysis (results not
shown).
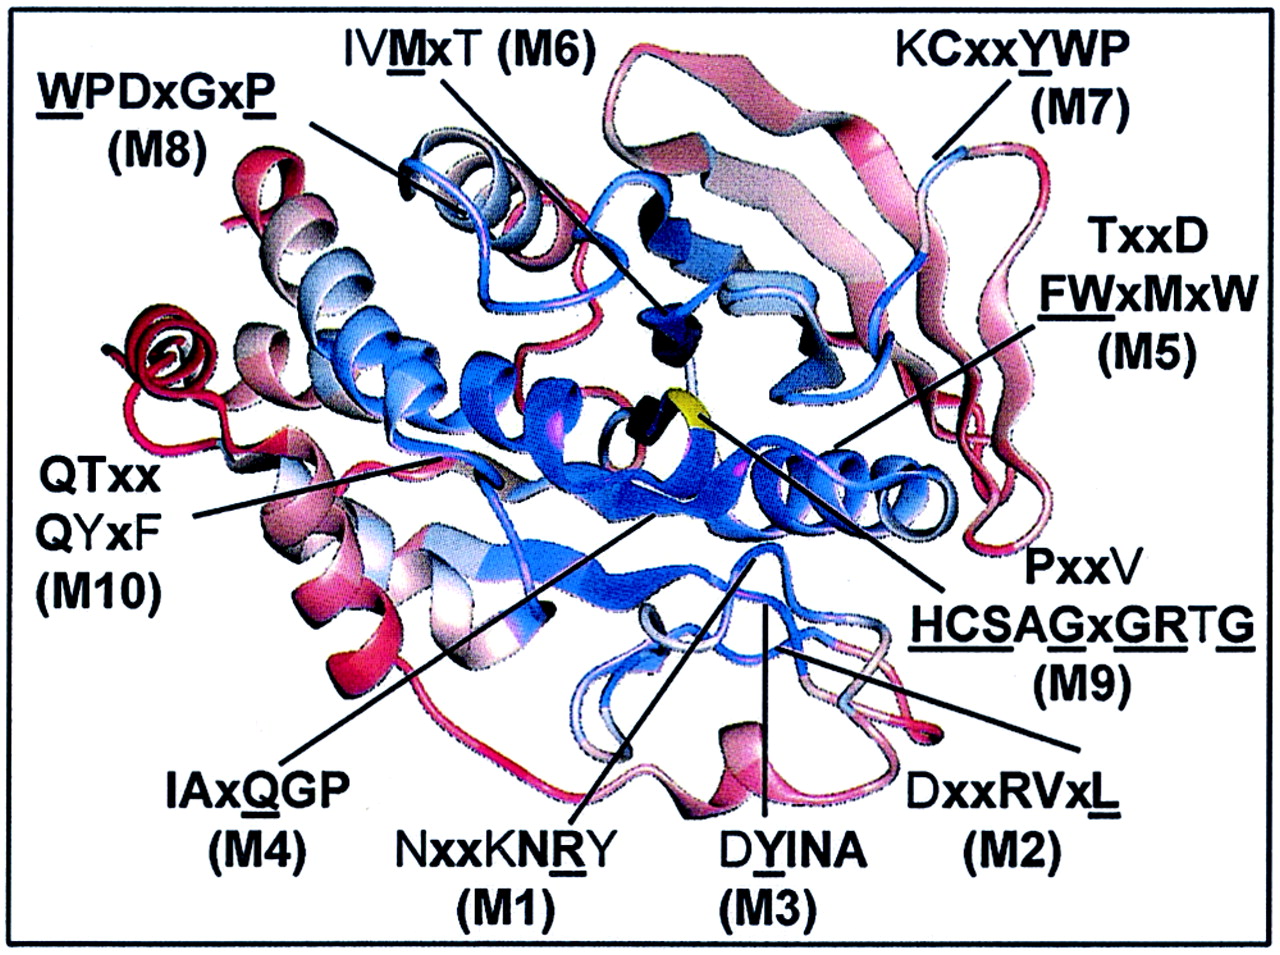
Core structures within the PTP domain are highly
conserved and surface loops between secondary structure elements are
least conserved. Shown is a ribbon diagram indicating the positions of
conserved motifs (M1 to M10) within the tertiary structure. The degree
of conservation was determined from Cα-regiovariation score analysis
of 37 aligned human PTP catalytic domains (see Fig. 5). Areas of
conservation (blue, most conserved; red, least conserved) are
illustrated using the PTP1B catalytic domain as the representative
tertiary structure. Shown is the front view of PTP1B looking into the
active site. The catalytically essential Cys215 residue is shown in
yellow.

PTP domains from cytoplasmic PTPs and RPTP domains D1
and D2 show significant differences in their conservation of
surface-exposed amino acids. Shown is surface conservation (blue, most
conserved; red, least conserved) of PTP domains from nontransmembrane
PTPs (A), RPTP domains D1 (B), and RPTP domains D2 (C). Shown is the
front view looking into the active site. Cα-regiovariation score
values for the cytoplasmic PTPs are illustrated using the X-ray crystal
structure of PTP1B with the catalytically essential Cys215 (yel low) and epidermal growth factor receptor-derived peptide
(green) bound within the active site (closed conformation). For ease of
comparison, Cα-regiovariation score values among RPTP domains D1 and
D2 sequences are illustrated using the X-ray crystal structure of
RPTPα domain D1 (50). The EGFR peptide (green) is
modeled in the active site of RPTPα for orientation using only a
closed conformation of the X-ray crystal structures. Amino acids are
labeled according to the residue position in human PTP1B with the
equivalent residues in RPTPα given in brackets (A and B). The
conserved four-residue structural linker located at the N terminus of
domain D2 (encircled area 1 in panel C), and which constrains the
relative orientation of tandem PTP domains in LAR, is compared to the
corresponding nonconserved area for the RPTP domain D1 sequences
(encircled area 1 in panel B). The amino acid residues defining this
conserved linker are boxed and colored yellow in the alignment in Fig.
1.

Identification of novel conserved area on surface of PTP
domain opposite active site. Shown are surface conservation
(Cα-regiovariation score values) among nontransmembrane PTPs (A),
RPTP domains D1 (B), and RPTP domains D2 (C). The tertiary structure is
rotated 180° compared to structures in Fig. 7, showing the surface of
the molecule opposite the active site. Encircled area II (B and C)
corresponds to the interface for domains D1 and D2 as revealed in the
X-ray crystal structure of LAR (56). Encircled area III is
a novel putative interactive site, which appears to be conserved in all
three subsets of PTP domain sequences. Amino acids are labeled
according to the residue positions in PTP1B (A) and RPTPα (B
and C).
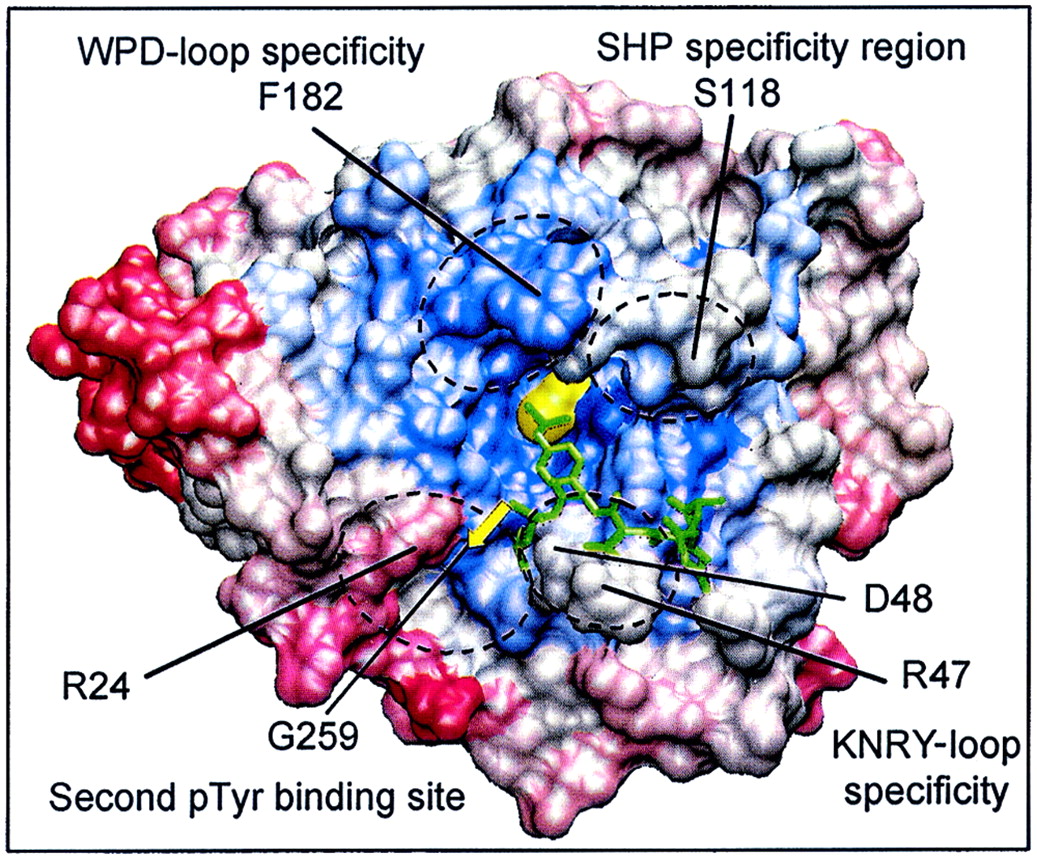
Nonconserved amino acids in the proximity of the PTP
active site are involved in the recognition of PTP substrates and
nonpeptide PTP inhibitors. Shown is the visualization of four
selectivity-determining regions on the molecular surface of PTP1B.
Areas of conservation (blue, most conserved; red, least conserved)
represent the Cα-regiovariation score values of 37 aligned human PTP
catalytic domains (values from Fig. 5). The amino acids involved in
defining these four selectivity-determining regions are indicated
(boxed) in the alignment in Fig. 1.
References
-
- Alexander D R. The CD45 tyrosine phosphatase: a positive and negative regulator of immune cell function. Semin Immunol. 2000;12:349–359. - PubMed
-
- Altschul S F, Gish W, Miller W, Myers E W, Lipman D J. Basic local alignment search tool. J Mol Biol. 1990;215:403–410. - PubMed
-
- Angers-Loustau A, Cote J F, Tremblay M L. Roles of protein tyrosine phosphatases in cell migration and adhesion. Biochem Cell Biol. 1999;77:493–505. - PubMed
-
- Apweiler R, Attwood T K, Bairoch A, Bateman A, Birney E, Biswas M, Bucher P, Cerutti L, Corpet F, Croning M D, Durbin R, Falquet L, Fleischmann W, Gouzy J, Hermjakob H, Hulo N, Jonassen I, Kahn D, Kanapin A, Karavidopoulou Y, Lopez R, Marx B, Mulder N J, Oinn T M, Pagni M, Servant F. The InterPro database, an integrated documentation resource for protein families, domains and functional sites. Nucleic Acids Res. 2001;29:37–40. - PMC - PubMed
Publication types
MeSH terms
Substances
Grants and funding
LinkOut - more resources
Full Text Sources
Other Literature Sources