. 2001 Oct 15;21(20):7889-900.
doi: 10.1523/JNEUROSCI.21-20-07889.2001.

Estimation of quantal size and number of functional active zones at the calyx of Held synapse by nonstationary EPSC variance analysis

Affiliations

Estimation of quantal size and number of functional active zones at the calyx of Held synapse by nonstationary EPSC variance analysis

A C Meyer et al. J Neurosci. .

Abstract

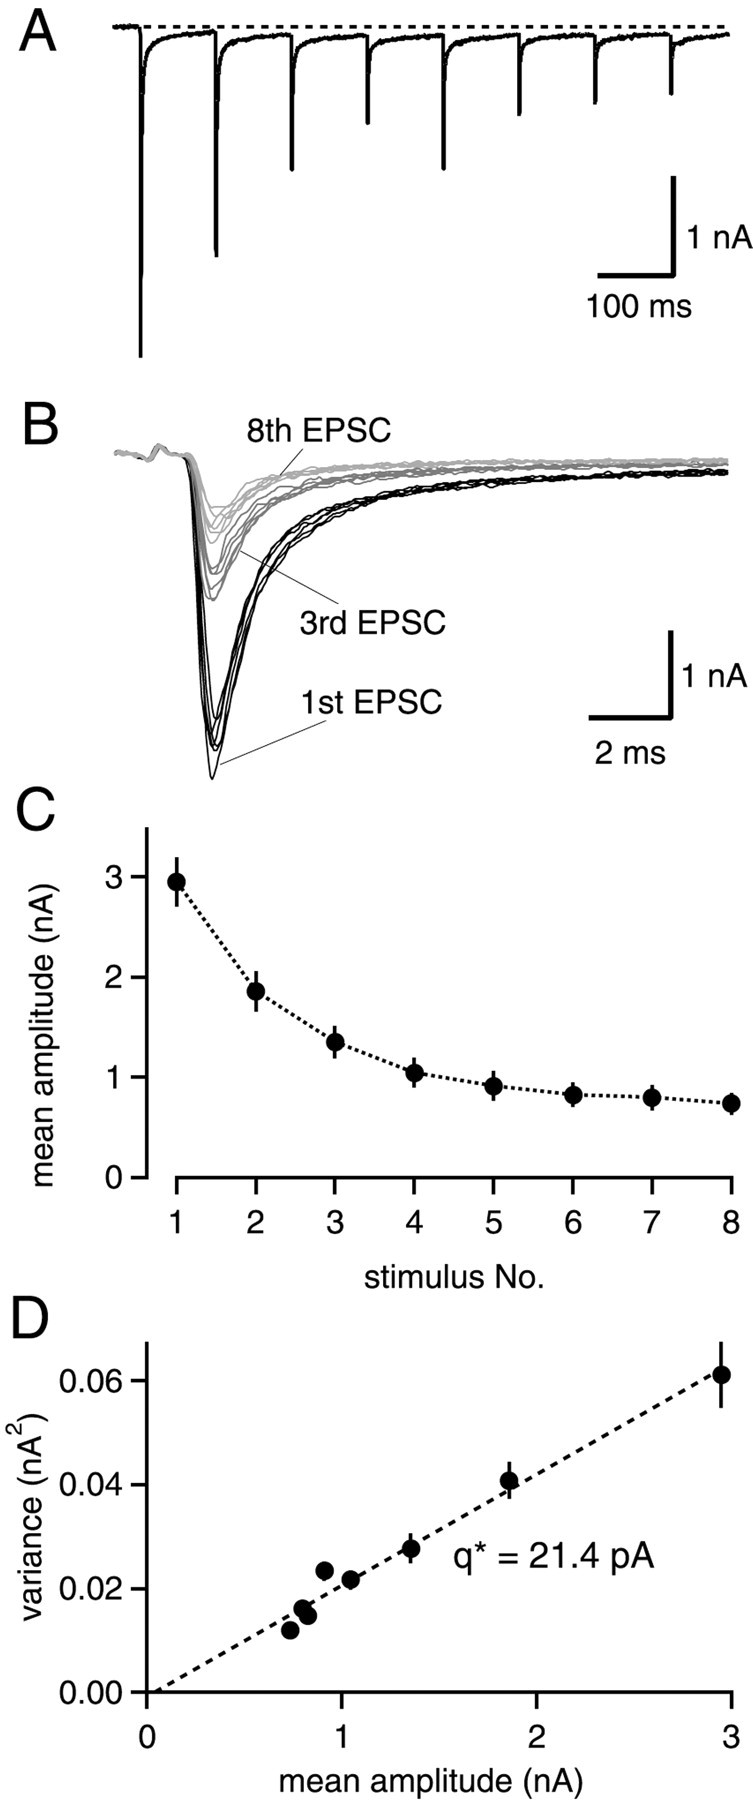
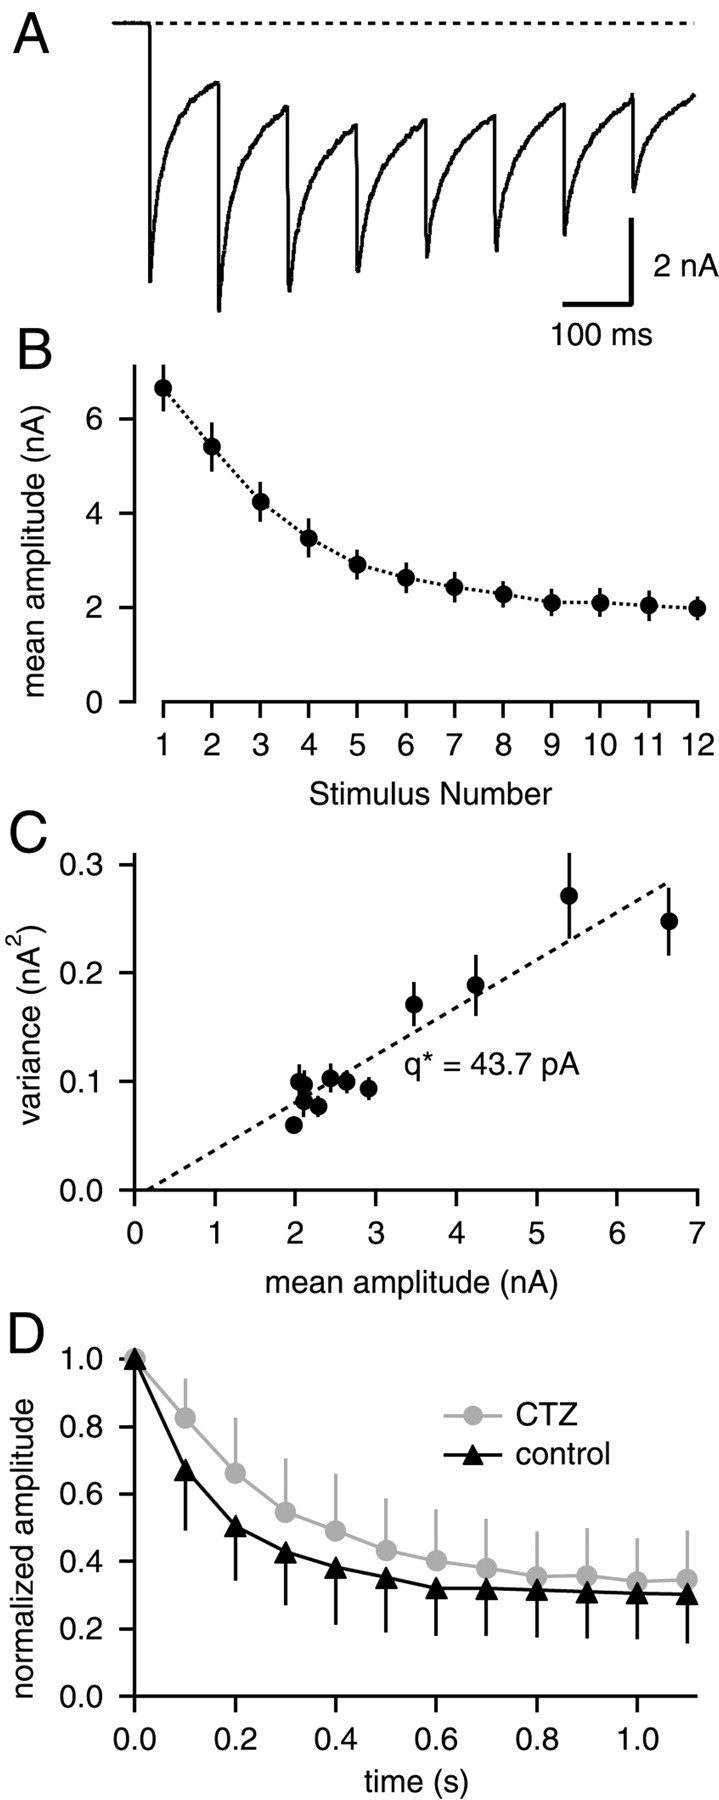
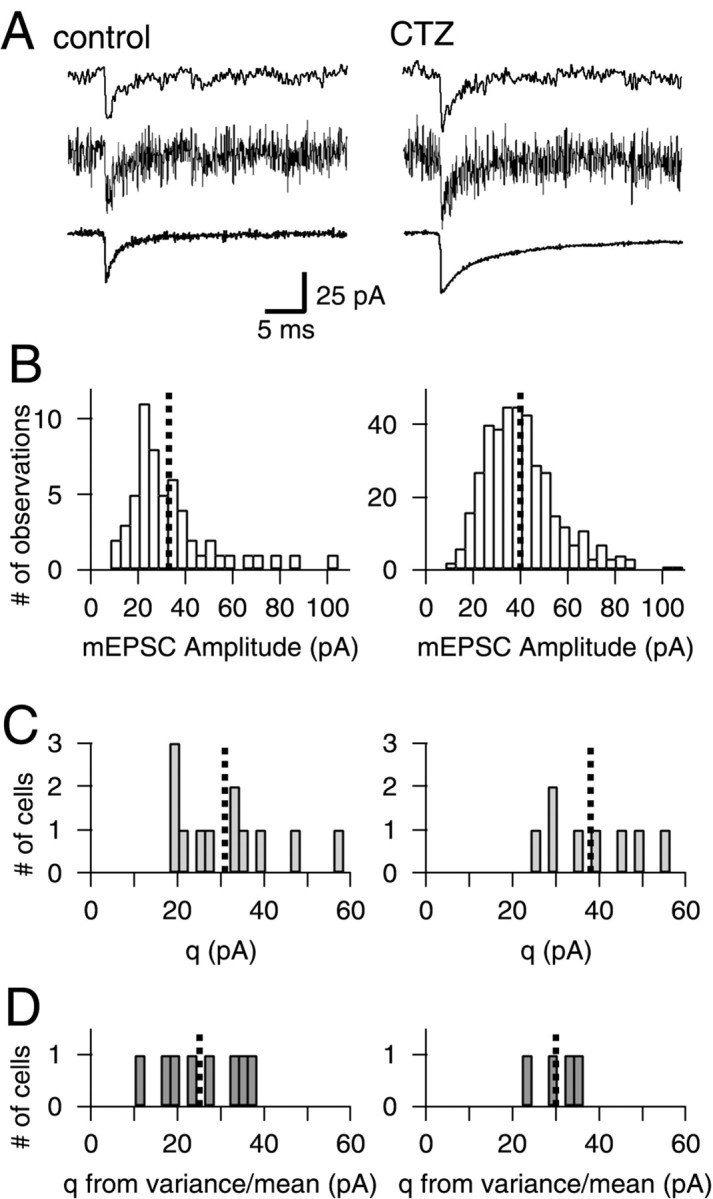
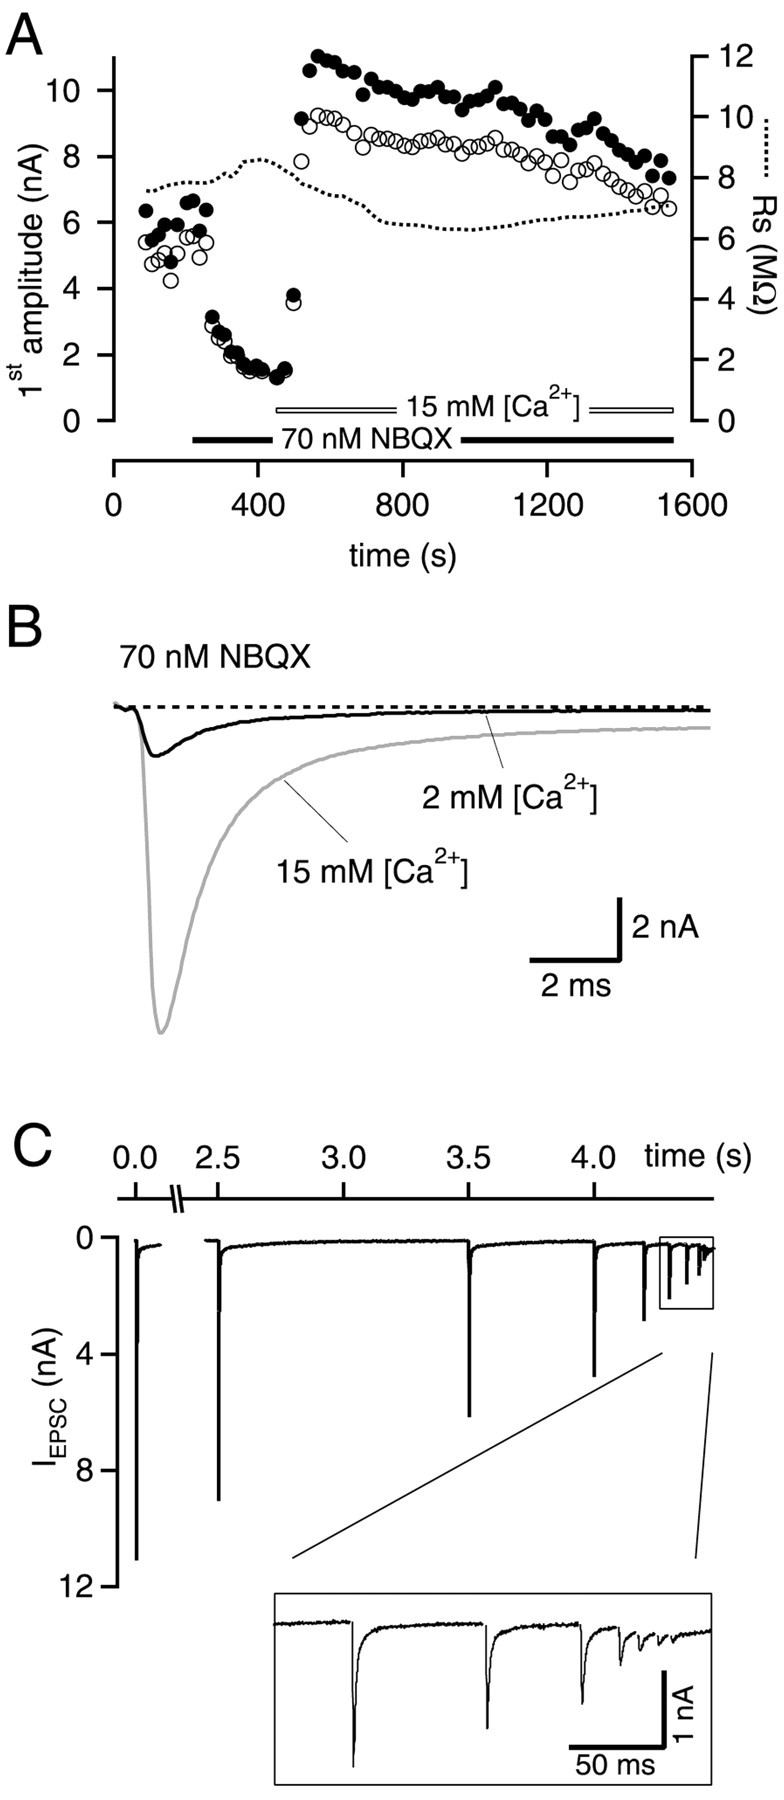
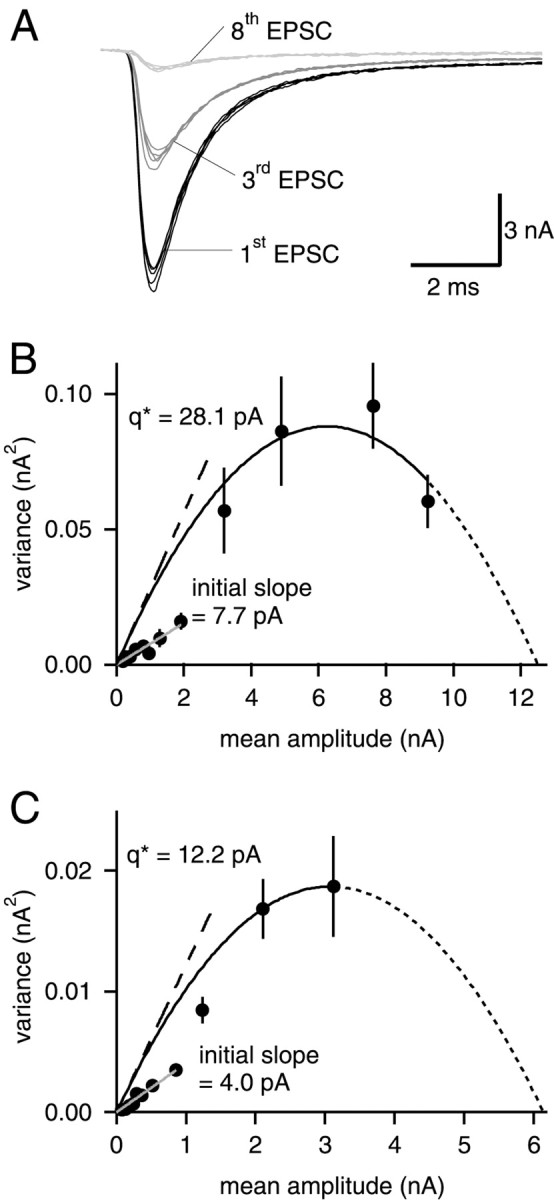
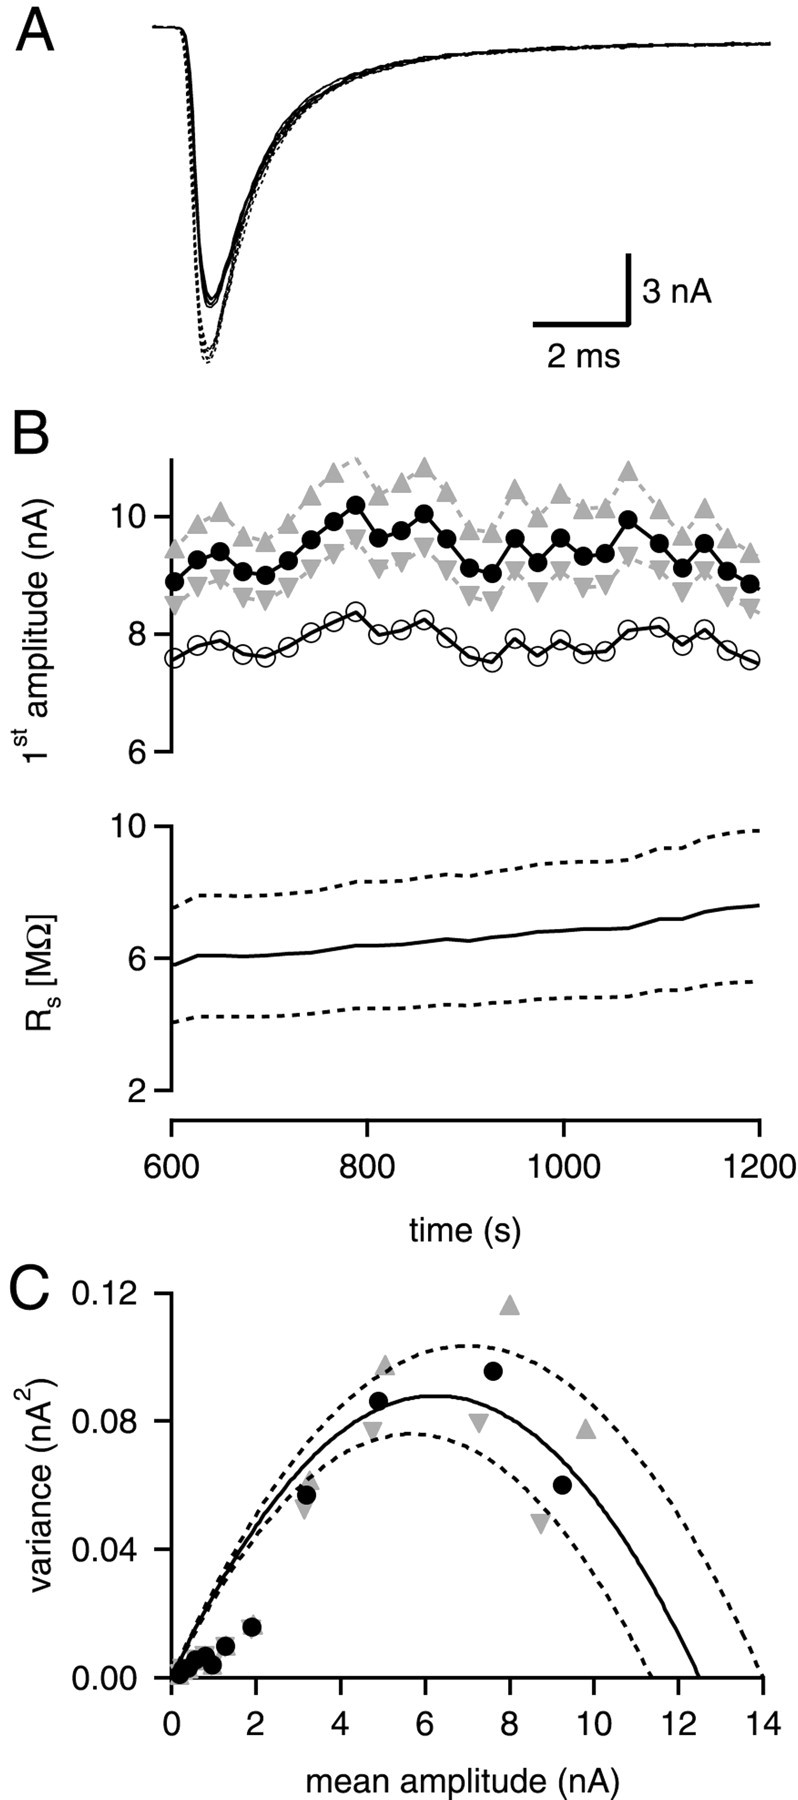
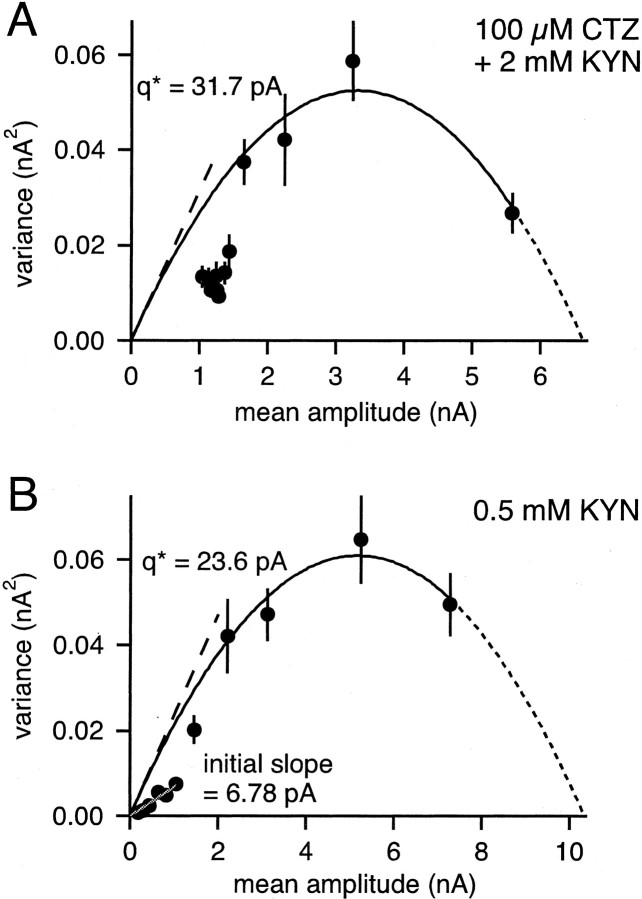
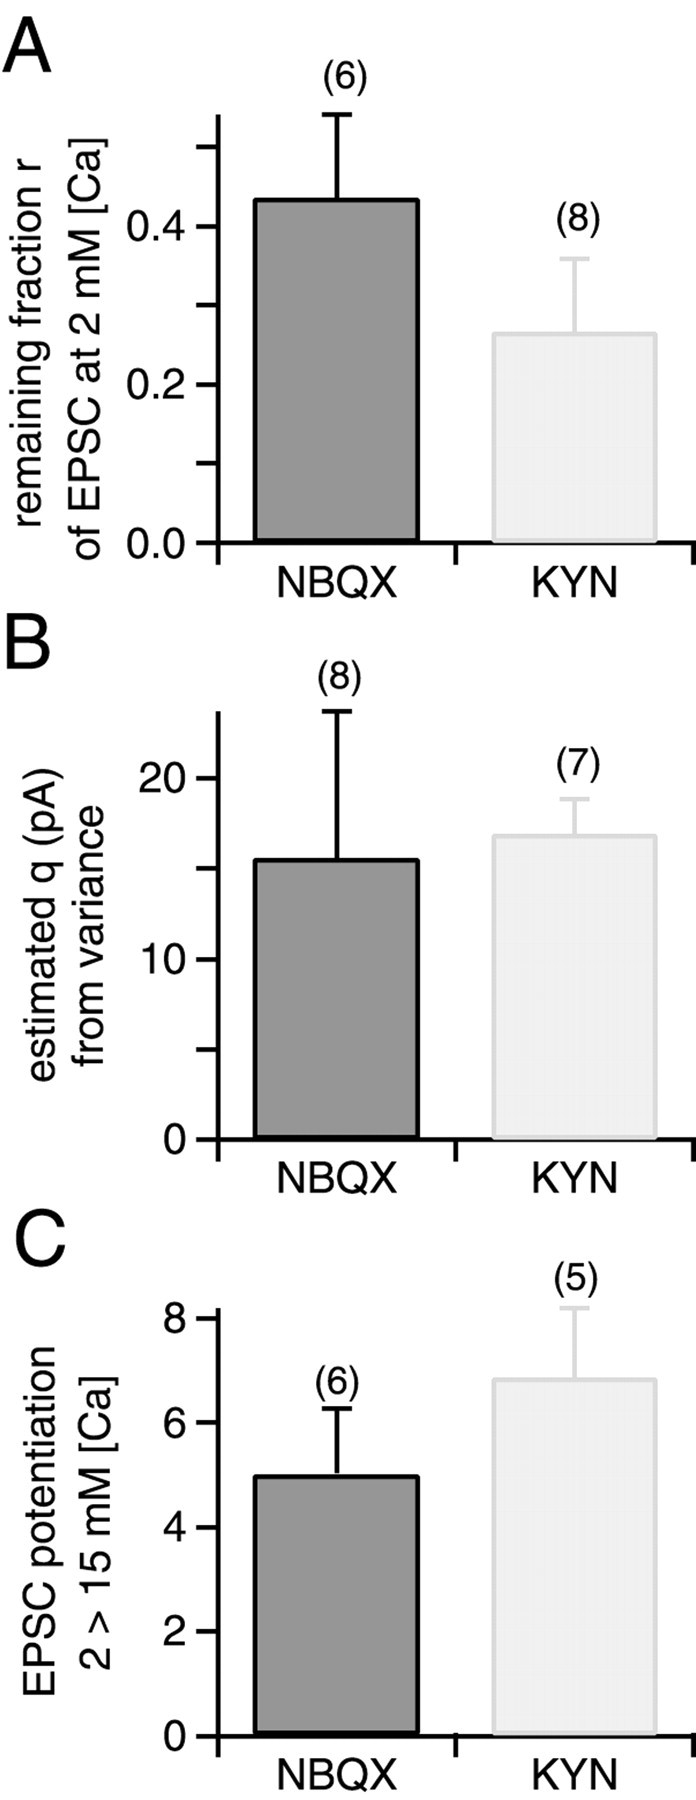
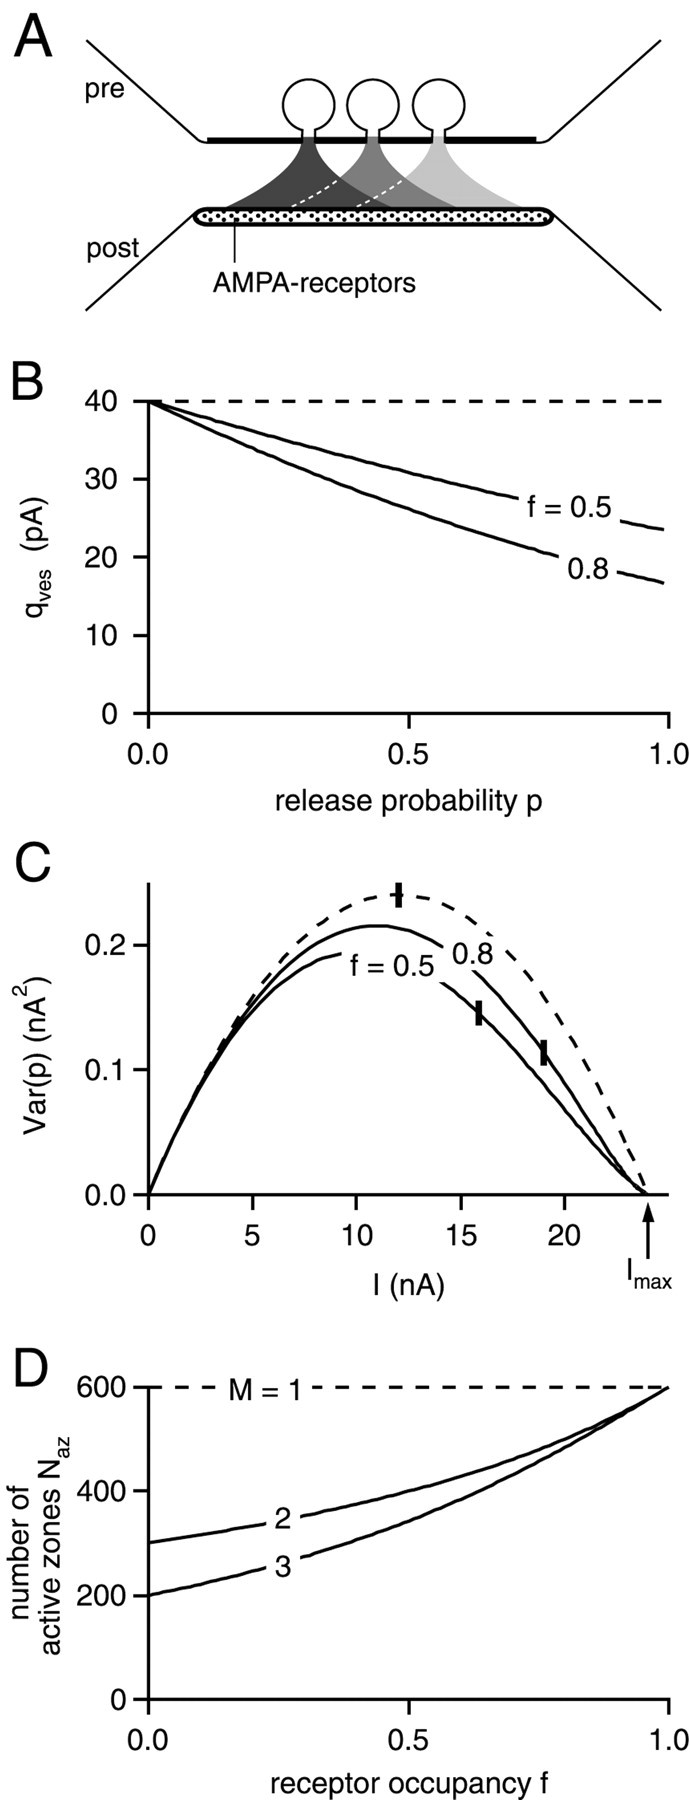
At the large excitatory calyx of Held synapse, the quantal size during an evoked EPSC and the number of active zones contributing to transmission are not known. We developed a nonstationary variant of EPSC fluctuation analysis to determine these quantal parameters. AMPA receptor-mediated EPSCs were recorded in slices of young (postnatal 8-10 d) rats after afferent fiber stimulation, delivered in trains to induce synaptic depression. The means and the variances of EPSC amplitudes were calculated across trains for each stimulus number. During 10 Hz trains at 2 mm Ca(2+) concentration ([Ca(2+)]), we found linear EPSC variance-mean relationships, with a slope that was in good agreement with the quantal size obtained from amplitude distributions of spontaneous miniature EPSCs. At high release probability with 10 or 15 mm [Ca(2+)], competitive antagonists were used to partially block EPSCs. Under these conditions, the EPSC variance-mean plots could be fitted with parabolas, giving estimates of quantal size and of the binomial parameter N. With the rapidly dissociating antagonist kynurenic acid, quantal sizes were larger than with a slowly dissociating antagonist, suggesting that the effective glutamate concentration was increased at high release probability. Considering the possibility of multivesicular release and moderate saturation of postsynaptic AMPA receptors, we conclude that the binomial parameter N (637 +/- 117; mean +/- SEM) represents an upper limit estimate of the number of functional active zones. We estimate that during normal synaptic transmission, the probability of vesicle fusion at single active zones is in the range of 0.25-0.4.


Figures

Fig. 1.
Fig. 1.
Nonstationary EPSC variance–mean analysis during 10 Hz trains. A, A single postsynaptic current trace in response to a 10 Hz stimulus train. B, The first, third and eighth EPSC of six consecutive stimulus trains at higher time resolution. C, Mean EPSC amplitudes and their SDs for 125 consecutive trains as a function of stimulus number.D, Plot of EPSC variance as a function of mean EPSC amplitudes, for the same data set as shown in C. Linear regression yields a slope of 21.4 pA in this example.
Fig. 2.
Fig. 2.
EPSC variance-mean analysis during 10 Hz stimulation in the presence of CTZ. A, EPSCs in response to a 10 Hz train in the presence of 100 μm CTZ.B, Mean ± SD of EPSC amplitudes in the presence of CTZ, averaged for 65 consecutive trains. C, The resulting EPSC variance–mean plot, fitted by linear regression with a slope of 43.7 pA. Data in A–C are from the same cell.D, Average depression with 10 Hz trains under control conditions, and with 100 μm CTZ. In each cell (n = 7), depression was first measured under control, followed by measurements with CTZ. EPSC amplitudes were normalized to the first amplitude to obtain average time courses of depression.
Fig. 3.
Fig. 3.
The mean of mEPSC amplitude distributions matches the quantal size q determined from the slope of EPSC variance–mean plots. A, Spontaneous mEPSCs under control conditions (left) and in the presence of CTZ (right). Top and middle traces represent single events filtered at 2 and 6 kHz, respectively. Bottom trace, Averages of events filtered at 6 kHz. B, mEPSC amplitude distributions for the same cell as shown in A. The mean amplitude (dotted line) increased from 32.9 pA (55 events) to 39.8 pA in CTZ (386 events). C, Histograms of the means obtained from mEPSC amplitude distributions. Left, Control,n = 12 cells, mean = 30.9 ± 12.0 pA;right, CTZ, n = 8 cells, mean = 38.0 ± 10.5 pA. D, Quantal size from EPSC variance–mean analysis obtained with 10 Hz stimulus trains at 2 mm [Ca2+] (Figs. 1, 2), corrected for the CV of mEPSC distributions for control and CTZ conditions (Eq. 4).Left, Control, n = 8 cells, mean = 25.1 ± 9.6 pA; right, CTZ,n = 4 cells, mean = 30.1 ± 5.8 pA. InB–D, the means of the distributions are indicated byvertical dotted lines.
Fig. 4.
Fig. 4.
Design of the experiments with elevated extracellular [Ca2+]. A, Stability plot of amplitudes of first EPSCs in the train and series resistanceRs during a typical experiment. Open circles denote EPSC amplitudes measured from digitized EPSC traces. Filled circles represent EPSC amplitudes measured from traces that have undergone an additional off-line compensation of voltage-clamp errors (see Materials and Methods). Time 0 refers to the start of whole-cell recording. In these experiments, part of the EPSCs were first blocked by a competitive antagonist (NBQX in this case). In the presence of the antagonist, the [Ca2+] in the bath was then increased.B, Sample traces for EPSCs recorded at two different [Ca2+] in the presence of NBQX. C, EPSCs in response to the stimulus trains used for these experiments, recorded with 15 mm [Ca2+] and 70 nm NBQX. Stimulus artifacts have been removed for clarity. Note the constant decrement of EPSC amplitudes that was achieved by this stimulation protocol. Data in A–C are from the same experiment.
Fig. 5.
Fig. 5.
The EPSC variance–mean relationships at elevated [Ca2+] can be fitted with parabolas.A, EPSCs recorded in the presence of 15 mm[Ca2+] and 70 nm NBQX. The first, third and eighth EPSC of five successive stimulus trains are shown.B, EPSC variance–mean relationship, obtained from analyzing 31 consecutive stimulus trains. Data points corresponding to the first four EPSCs in stimulus trains were fitted with a parabola, constrained to pass through the origin (solid line). Extrapolation of the parabola gave an x-axis intercept of 12.5 nA (dotted line). The value of q*predicted by the parabola fit (28.1 pA; dashed line) differs clearly from the slope of a line fitted to the last eight data points (7.7 pA; gray line). The values ofq* and of the initial slope were used to calculate quantal sizes q and qinitial slope given in Table 1, by applying Equation 4. Same cell as shown in A. C, Example of a cell in which the observed EPSC variance–mean relationship did not go through a maximum. The extrapolation of x-axis intercept toward large EPSCs has to be considered with caution; initial slopes, however, can be determined.
Fig. 6.
Fig. 6.
Possible effects of errors in theRs estimate. A, Three consecutive EPSCs recorded in the presence of 15 mm[Ca2+], 70 nm NBQX. The traces shown as solid lines represent the recorded current signals. The traces shown as dotted lines have been obtained after off-line compensation of the remainingRs error (Traynelis, 1998; see Material and Methods). In this example, the measured Rswas 6.1 MΩ, which was compensated electronically by 70%. The off-line compensation for the uncompensated fraction ofRs (1.8 MΩ) led to an increase by 19.3% of the EPSC amplitude. B, The bottom panel (solid line) showsRs measured before each stimulus train (see Materials and Methods). Introducing a deliberate overestimate or underestimate of Rs by ± 30% (bottom panel, dotted lines) causes an error for the back-calculated EPSC amplitudes (top panel, gray triangles). Open circles denote measured EPSC amplitudes before off-line compensation. Filled circlesand triangles show the EPSC amplitudes after off-line compensation, for 100%, and for 70 and 130% of the measuredRs value, respectively. C, Effect of the 30% error in the Rs estimate on EPSC variance–mean plots (same cell as in Fig. 5B).Symbols have the same meaning as in B.
Fig. 7.
Fig. 7.
EPSC variance–mean relationships in the presence of kyn and kyn together with cyclothiazide. A, Variance–mean plot of one cell in the presence of 100 μmCTZ and 2 mm kyn. A parabola was fitted to the first four data points (solid line). The uncorrected quantal sizeq* found by the fit is indicated by the dashed line (31.7 pA). B, Experiment in 0.5 mmkyn. Here, also the last seven data points could be fitted with a line (gray).
Fig. 8.
Fig. 8.
Summary of blocking efficiencies, estimated quantal sizes, and relative potentiation of EPSC amplitudes.A, Average values of the remaining fraction of peak EPSC amplitude (r) after applying 70 nmNBQX (left) or 0.5 mm kyn (right) in the presence of 2 mm[Ca2+] and 1 mm[Mg2+] (see Fig. 4A for an example). The number of cells examined for each condition is indicated.B, Average values of quantal size q, obtained from fitting parabolas to the first three or four data points in EPSC variance–mean plots (see Figs. 5, 7). Left panel, data obtained with 70 nm NBQX (Fig. 5, Table1); right panel, data obtained with 0.5 mmkyn (Fig. 7B, Table 2). C, Relative potentiation of EPSC amplitudes on switching the bath solution from 2 mm [Ca2+], 1 mm[Mg2+] to 15 mm[Ca2+], no added Mg2+.Left, data obtained with 70 nm NBQX;right, data obtained with 0.5 mm kyn. Note the slightly larger (p < 0.15) potentiation in the presence of the fast-off antagonist, kynurenic acid.
Fig. 9.
Fig. 9.
The influence of multivesicular release on the interpretation of the binomial parameter N.A, Schematic representation of the model used here (see Material and Methods for details). It is assumed thatM = 3 vesicles can fuse under conditions of high release probability during a presynaptic action potential, and that transmitter is released onto a common pool of postsynaptic AMPARs.B, Plot of average quantal size q per fused vesicle, as a function of release probability, p. In B and C, M was set to 3, and the calculations were made for the indicated values of receptor saturation, f. The dashed line inB–D shows the predictions for the case of the one vesicle–one active zone assumption (M = 1).C, EPSC variance–mean plot calculated from Equations 7and 8, for a synapse with Naz active zones. Naz was adjusted to produce a fixed value of Imax (24 nA), irrespective of the values for f and M. Vertical bars indicate the position in the curves corresponding to release probability p of 0.5.D, Number of active zones necessary to produce a maximal EPSC amplitude of 24 nA, as a function of receptor occupancy,f. Note that for the one vesicle–one active zone assumption (M = 1),Naz is equal to the binomial parameterN (600 in this case), independent of postsynaptic receptor occupancy f. This is not the case if more than one vesicle (M =2, 3) is allowed to fuse at each active zone.

Similar articles

Cited by

References

    1. Auger C, Kondo S, Marty A. Multivesicular release at single functional synaptic sites in cerebellar stellate and basket cells. J Neurosci. 1998;18:4532–4547. - PMC - PubMed
    1. Bollmann J, Sakmann B, Borst J. Calcium sensitivity of glutamate release in a calyx-type terminal. Science. 2000;289:953–957. - PubMed
    1. Borst JGG, Sakmann B. Calcium influx and transmitter release in a fast CNS synapse. Nature. 1996;383:431–434. - PubMed
    1. Borst JGG, Helmchen F, Sakmann B. Pre- and postsynaptic whole-cell recordings in the medial nucleus of the trapezoid body of the rat. J Physiol (Lond) 1995;489:825–840. - PMC - PubMed
    1. Brown TH, Perkel DH, Feldman MW. Evoked neurotransmitter release: statistical effects of nonuniformity and nonstationarity. Proc Natl Acad Sci USA. 1976;73:2913–2917. - PMC - PubMed

Publication types

MeSH terms

Substances

LinkOut - more resources