

Freshly isolated hippocampal CA1 astrocytes comprise two populations differing in glutamate transporter and AMPA receptor expression
- PMID: 11588163
- PMCID: PMC6763881
- DOI: 10.1523/JNEUROSCI.21-20-07901.2001
Freshly isolated hippocampal CA1 astrocytes comprise two populations differing in glutamate transporter and AMPA receptor expression
Abstract
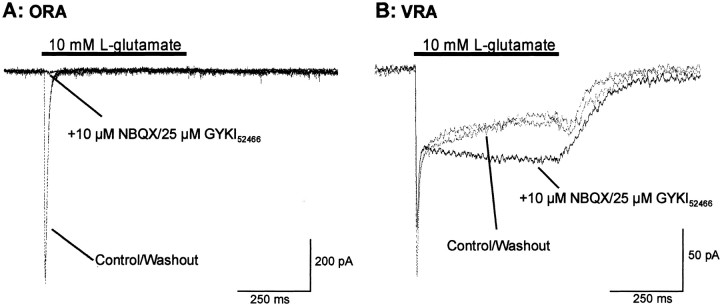
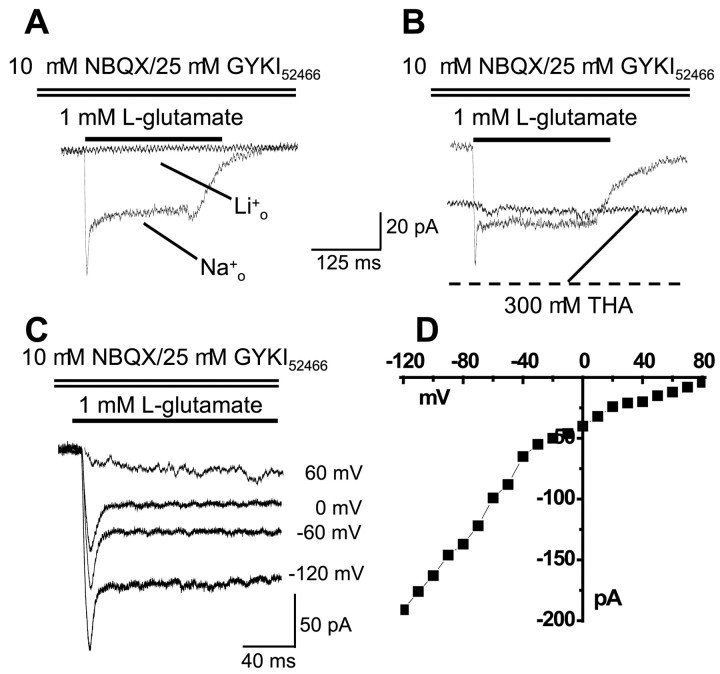
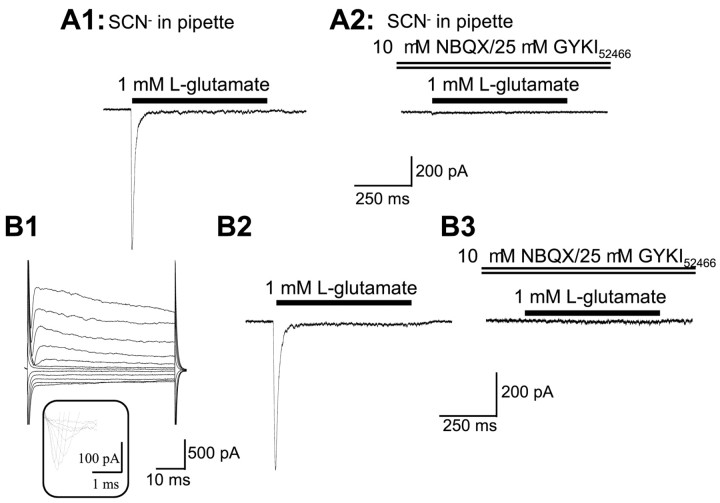
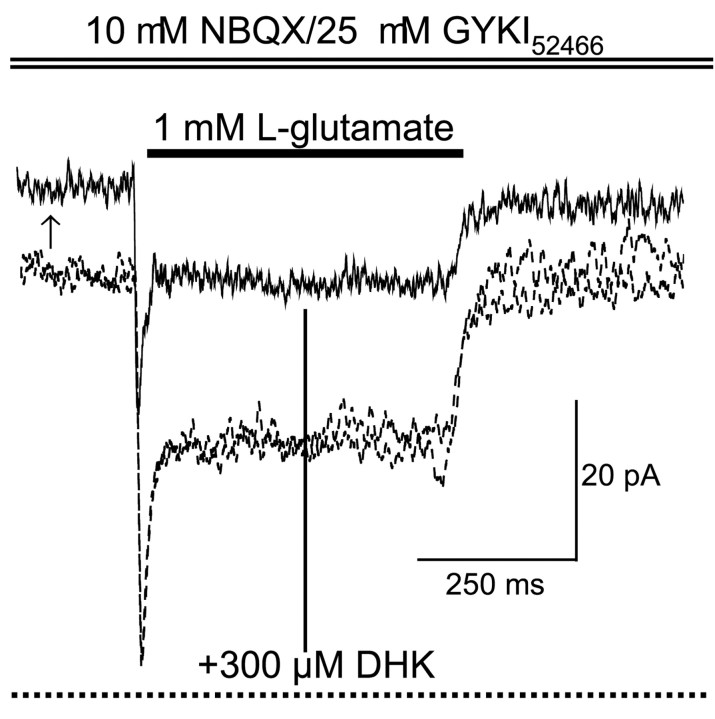
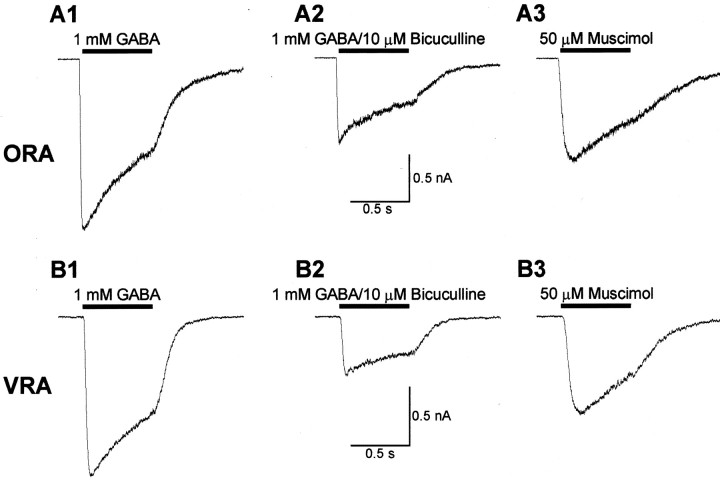
We have shown previously that process-bearing GFAP+ astrocytes freshly isolated from rat hippocampus CA1 and CA3 regions are heterogeneous in ion channel expression and K(+) uptake capabilities, such that two distinct populations of astrocytes can be described (Zhou and Kimelberg, 2000). In the present study, we report that glutamate transporter (GT) currents can only be measured from one type of these freshly isolated hippocampal CA1 astrocytes [variably rectifying astrocytes (VRAs)] but were not detectable in the second type of astrocyte [outwardly rectifying astrocytes (ORAs)]. The GT currents showed a strict Na(+) dependency and high affinity for glutamate (EC(50) of 4 +/- 1.1 microm). The astrocytes lacking GT currents (ORAs) showed an AMPA receptor current density (55 pA/pF) that was 42-fold higher than VRAs (1.3 pA/pF). In contrast, the GABA(A) currents were of comparable current density in both types. The specificity of these differences makes it unlikely that they are attributable to preparative damage. Therefore, these findings strongly indicate that, within a single region of the hippocampus, GFAP+ astrocytes comprise a functionally diverse population that are qualitatively different in their functional glutamate transporter and quantitatively different in their functional AMPA receptor expression. This heterogeneity implies that GFAP+ astrocytes may participate in or modulate glutamate synaptic transmission differently.
Figures


Similar articles
-
Freshly isolated astrocytes from rat hippocampus show two distinct current patterns and different [K(+)](o) uptake capabilities.J Neurophysiol. 2000 Dec;84(6):2746-57. doi: 10.1152/jn.2000.84.6.2746. J Neurophysiol. 2000. PMID: 11110805
-
Synaptically released glutamate does not overwhelm transporters on hippocampal astrocytes during high-frequency stimulation.J Neurophysiol. 2000 May;83(5):2835-43. doi: 10.1152/jn.2000.83.5.2835. J Neurophysiol. 2000. PMID: 10805681
-
AMPA receptor protein expression and function in astrocytes cultured from hippocampus.J Neurosci Res. 1999 Aug 15;57(4):557-71. J Neurosci Res. 1999. PMID: 10440906
-
Astrocyte glutamate transport: review of properties, regulation, and physiological functions.Glia. 2000 Oct;32(1):1-14. Glia. 2000. PMID: 10975906 Review.
-
Controversy surrounding the existence of discrete functional classes of astrocytes in adult gray matter.Glia. 2000 Aug;31(2):95-103. doi: 10.1002/1098-1136(200008)31:2<95::aid-glia10>3.0.co;2-6. Glia. 2000. PMID: 10878596 Review.
Cited by
-
Sodium Fluctuations in Astroglia and Their Potential Impact on Astrocyte Function.Front Physiol. 2020 Aug 12;11:871. doi: 10.3389/fphys.2020.00871. eCollection 2020. Front Physiol. 2020. PMID: 32903427 Free PMC article. Review.
-
Structural and Functional Remodeling of the Brain Vasculature Following Stroke.Front Physiol. 2020 Aug 7;11:948. doi: 10.3389/fphys.2020.00948. eCollection 2020. Front Physiol. 2020. PMID: 32848875 Free PMC article. Review.
-
Astroglial Glutamate Signaling and Uptake in the Hippocampus.Front Mol Neurosci. 2018 Jan 17;10:451. doi: 10.3389/fnmol.2017.00451. eCollection 2017. Front Mol Neurosci. 2018. PMID: 29386994 Free PMC article. Review.
-
NG2-glia from pallial progenitors produce the largest clonal clusters of the brain: time frame of clonal generation in cortex and olfactory bulb.J Neurosci. 2014 Feb 5;34(6):2305-13. doi: 10.1523/JNEUROSCI.3060-13.2014. J Neurosci. 2014. PMID: 24501369 Free PMC article.
-
NMDA Receptors in Astrocytes: In Search for Roles in Neurotransmission and Astrocytic Homeostasis.Int J Mol Sci. 2019 Jan 14;20(2):309. doi: 10.3390/ijms20020309. Int J Mol Sci. 2019. PMID: 30646531 Free PMC article. Review.
References
-
- Anderson CM, Swanson RA. Astrocyte glutamate transport: review of properties, regulation, and physiological functions. Glia. 2000;32:1–14. - PubMed
-
- Baranano DE, Ferris CD, Snyder SH. Atypical neural messengers. Trends Neurosci. 2001;24:99–106. - PubMed
-
- Bergles DE, Jahr CE. Synaptic activation of glutamate transporters in hippocampal astrocytes. Neuron. 1997;19:1297–1308. - PubMed
-
- Bergles DE, Roberts JD, Somogyi P, Jahr CE. Glutamatergic synapses on oligodendrocyte precursor cells in the hippocampus. Nature. 2000;405:187–191. - PubMed
Publication types
MeSH terms
Substances
Grants and funding
LinkOut - more resources
Full Text Sources
Miscellaneous