. 2001 Oct 15;21(20):7909-18.
doi: 10.1523/JNEUROSCI.21-20-07909.2001.

Gating properties of Na(v)1.7 and Na(v)1.8 peripheral nerve sodium channels

Affiliations

Gating properties of Na(v)1.7 and Na(v)1.8 peripheral nerve sodium channels

K Vijayaragavan et al. J Neurosci. .

Abstract

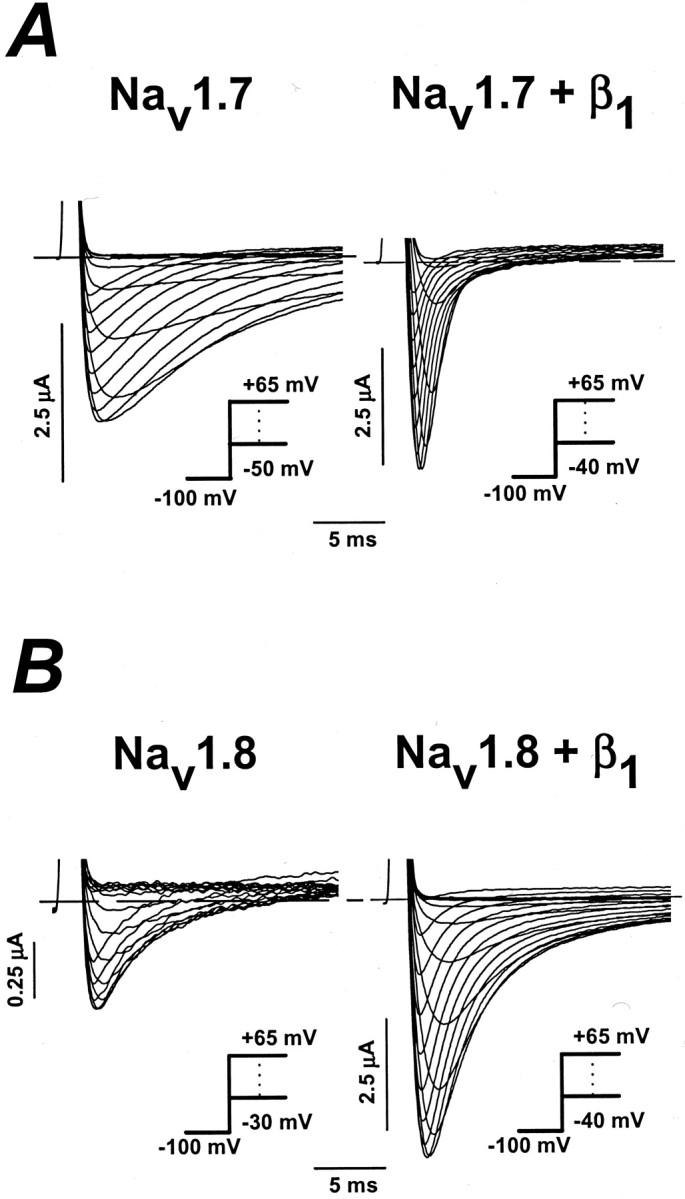
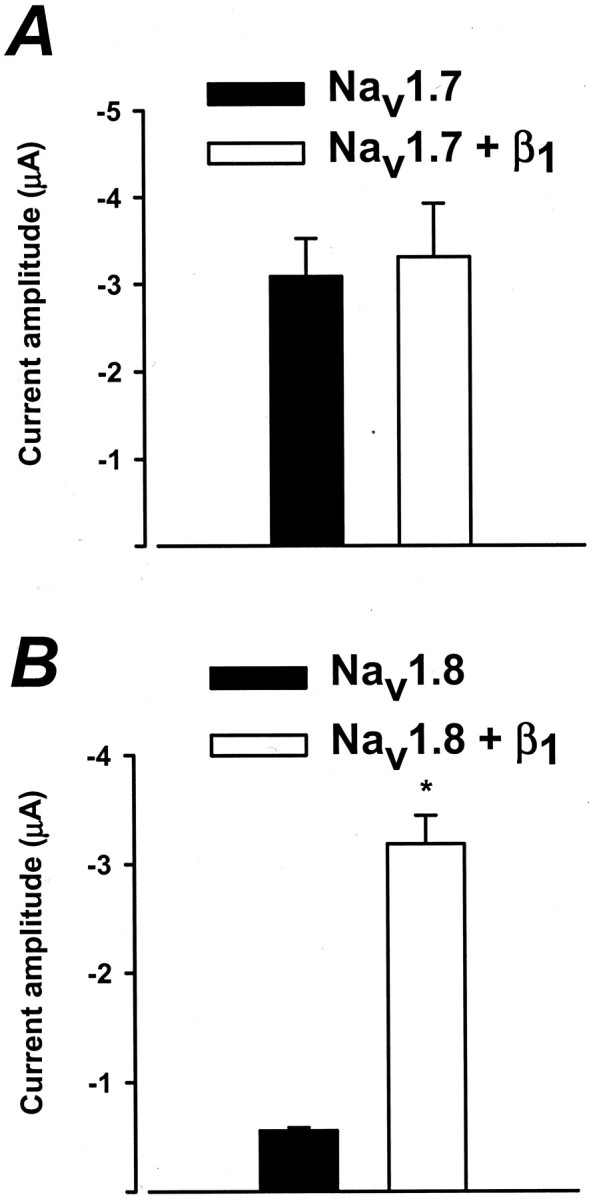
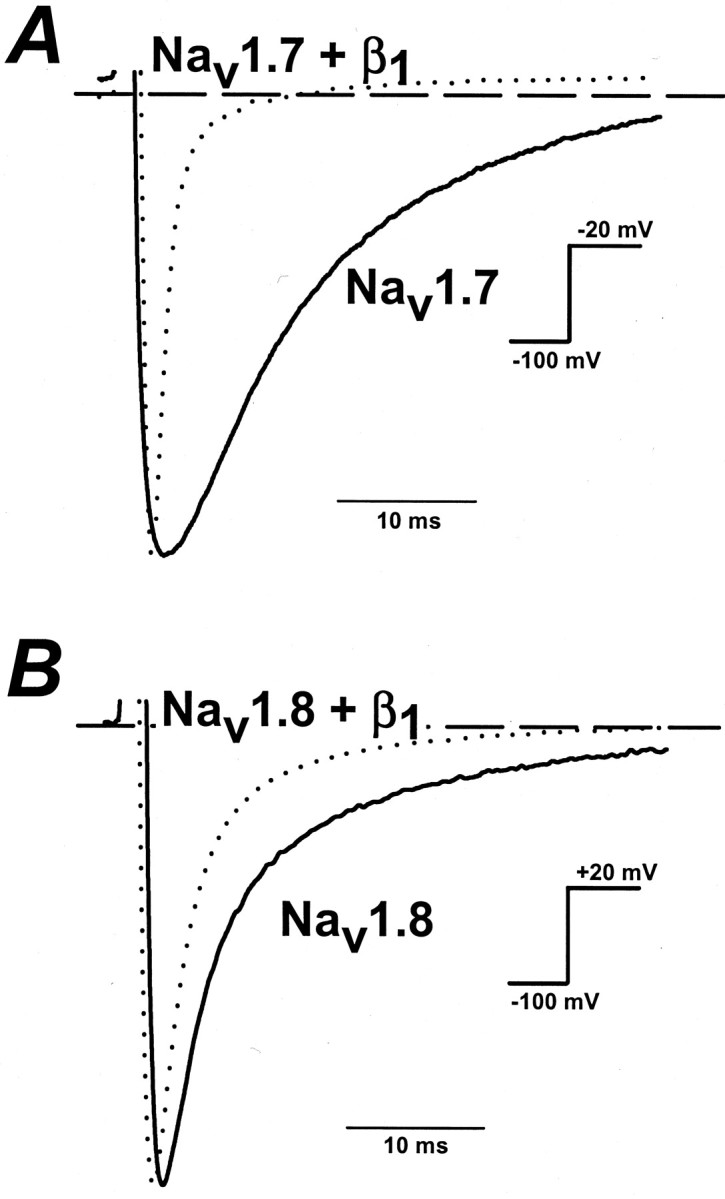
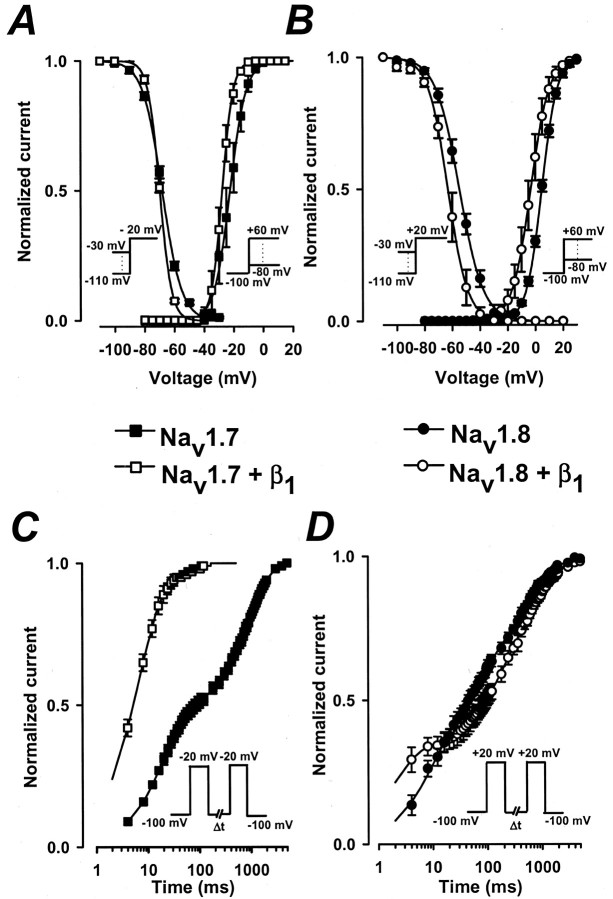
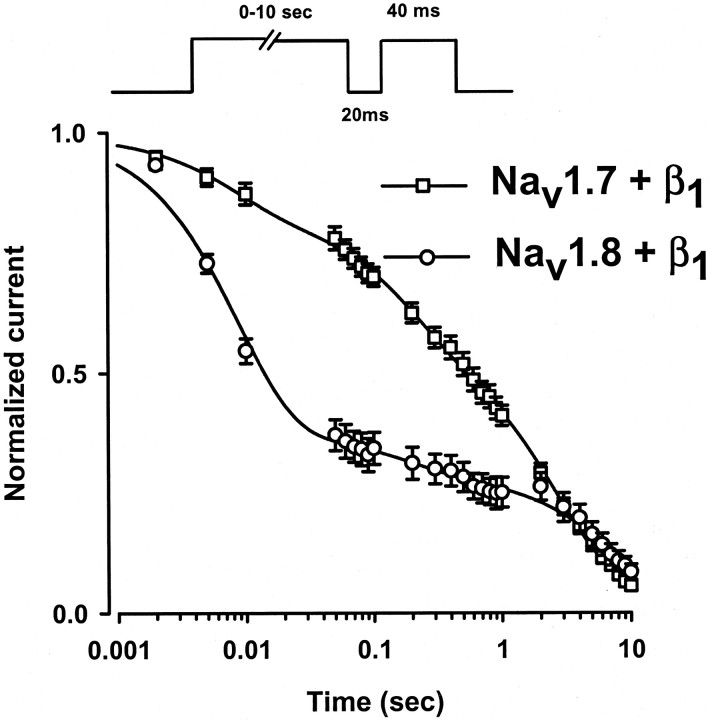
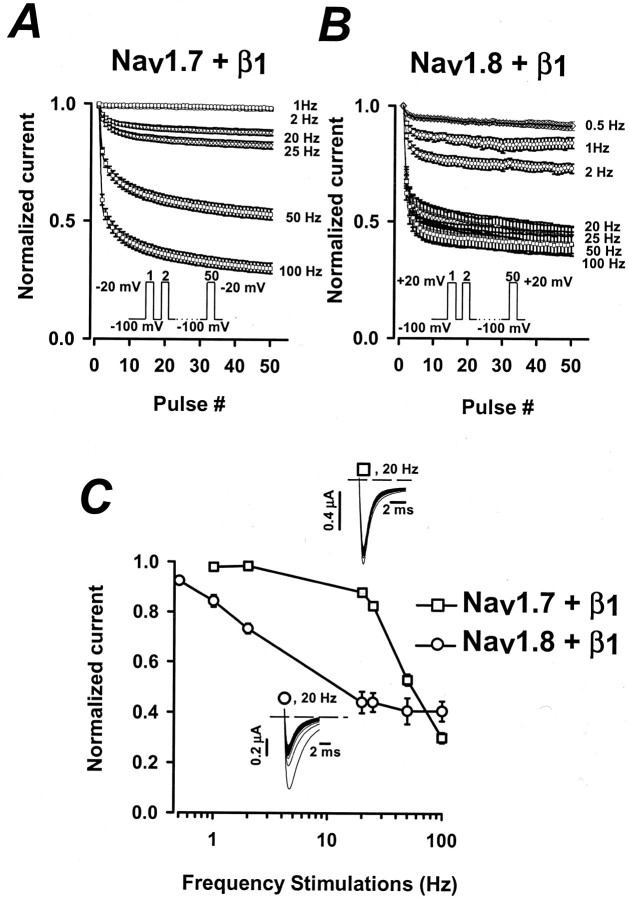
Several distinct components of voltage-gated sodium current have been recorded from native dorsal root ganglion (DRG) neurons that display differences in gating and pharmacology. This study compares the electrophysiological properties of two peripheral nerve sodium channels that are expressed selectively in DRG neurons (Na(v)1.7 and Na(v)1.8). Recombinant Na(v)1.7 and Na(v)1.8 sodium channels were coexpressed with the auxiliary beta(1) subunit in Xenopus oocytes. In this system coexpression of the beta(1) subunit with Na(v)1.7 and Na(v)1.8 channels results in more rapid inactivation, a shift in midpoints of steady-state activation and inactivation to more hyperpolarizing potentials, and an acceleration of recovery from inactivation. The coinjection of beta(1) subunit also significantly increases the expression of Na(v)1.8 by sixfold but has no effect on the expression of Na(v)1.7. In addition, a great percentage of Na(v)1.8+beta(1) channels is observed to enter rapidly into the slow inactivated states, in contrast to Nav1.7+beta(1) channels. Consequently, the rapid entry into slow inactivation is believed to cause a frequency-dependent reduction of Na(v)1.8+beta(1) channel amplitudes, seen during repetitive pulsing between 1 and 2 Hz. However, at higher frequencies (>20 Hz) Na(v)1.8+beta(1) channels reach a steady state to approximately 42% of total current. The presence of this steady-state sodium channel activity, coupled with the high activation threshold (V(0.5) = -3.3 mV) of Na(v)1.8+beta(1), could enable the nociceptive fibers to fire spontaneously after nerve injury.


Figures

Fig. 1.
Fig. 1.
Effects of the β1 subunit on Nav1.7 and Nav1.8 sodium channels heterologously expressed in Xenopus oocytes. The data show the whole-cell sodium currents of oocytes expressing either the Nav1.7 or Nav1.8 sodium channel with and without the β1 subunit. Currents were elicited by depolarizing steps between −50 and +65 mV in 5 mV increments from a holding potential of −100 mV (see inset).A, Whole-cell Nav1.7 currents measured in the absence (left) and presence (right) of the β1 subunit. B, Nav1.8 sodium currents expressed without (left) and with (right) the β1 subunit. Dashed lines are the zero current levels.
Fig. 2.
Fig. 2.
Effects of the β1 subunit on the expression of Nav1.7 and Nav1.8 sodium channels. Shown are the whole-cell sodium currents of paired groups of oocytes expressing either the Nav1.7 or Nav1.8 channels with or without the β1 subunit. Nav1.7 peak currents at −20 mV were measured from oocytes expressing Nav1.7 or Nav1.7+β1after 24 hr of incubation. There was no significant difference in the peak amplitude of current between Nav1.7 and Nav1.7+β1 even at 3 d after injection (data not shown). For Nav1.8 channels the peak currents measured at +20 mV were compared 6 d after cRNA injection. Peak amplitude recorded 3 d after injection for Nav1.8 channels was small (38.1 ± 2.8 nA; n = 3), whereas the coexpression increased expression by 17-fold (695 ± 117 nA;n = 5; data not shown). The β1subunit significantly increased (p < 0.05) the currents of Nav1.8 (n = 7), but not the Nav1.7 (n = 6), sodium channels (p < 0.05). The holding potential was −100 mV.
Fig. 3.
Fig. 3.
Effects of the β1 subunit on the kinetics of Nav1.7 and Nav1.8 inactivation. Whole-cell sodium currents of Nav1.7 and Nav1.7+β1 sodium channels were elicited by a depolarizing step from −100 to −20 or +20 mV. Currents were normalized to facilitate comparison of the kinetics. A, At −20 mV the time constants of current decay were 19.8 ± 3.6 msec (n = 6) and 1.8 ± 0.2 msec (n = 6) for Nav1.7 and Nav1.7+β1, respectively.B, Nav1.8 and Nav1.8+β1 currents were elicited by a step depolarization to +20 mV and had decay time constants of 4.3 ± 0.2 msec (n = 6) and 2.6 ± 0.1 msec (n = 6), respectively. Dashed linesare the zero current levels.
Fig. 4.
Fig. 4.
The β1 subunit accelerates the inactivation of Nav1.7 and Nav1.8 channels. The decay of the Nav1.7 and Nav1.8 sodium currents (Fig. 1) was fit to an exponential function, and the time constants were plotted versus the test voltage: I =AI · exp (−ti) + C, where I is the current,Ai is the percentage of channels inactivating with time constant τi,t is time, and C is the steady-state asymptote. The data are the means ± SEM of n= 6 for Nav1.7 and Nav1.7+β1 andn = 6 for Nav1.8 and Nav1.8+β1 channels. A, The inactivation time constants of Nav1.7 (filled squares) and Nav1.7+β1 (open squares) plotted versus voltage. B, The time constants of Nav1.8 (filled circles) and Nav1.8+β1 (open circles) plotted versus voltage.
Fig. 5.
Fig. 5.
Effects of the β1 subunit on the activation, inactivation, and recovery of Nav1.7 and Nav1.8 channels. Activation was measured by applying a series of depolarizing voltage pulses between −80 and +60 mV from a holding potential of −100 mV. The peak currents were measured, and the relative conductance was calculated by using the standard procedures (see Materials and Methods). Also plotted is the steady-state availability curve that was determined by using 500 msec conditioning pulses to voltages between −110 and +30 mV and a standard test pulse to either −20 mV (Nav1.7 and Nav1.7+β1) or +20 mV (Nav1.8 and Nav1.8+β1). Test currents were normalized and plotted versus conditioning voltage.A, The normalized conductance versus voltage and steady-state inactivation plots of Nav1.7 (filled squares) and Nav1.7+β1 (open squares) channels. The smooth curves are Boltzmann fits:G = 1/(1 + exp ((VV0.5)/−k)), with midpoints (V0.5) and slope factors (k) of activation of −22 ± 2.7 and 5.4 ± 0.4 mV for Nav1.7 (n = 10) and −27.7 ± 1.3 and 3.7 ± 0.2 mV for Nav1.7+β1 (n = 11). For inactivation the V0.5 and k values are −68.2 ± 0.43 and 6.4 ± 0.45 mV for Nav1.7 (n = 4) and −69.8 ± 0.3 and 3.9 ± 0.2 mV for Nav1.7+β1 (n = 4).B, Steady-state activation and inactivation of Nav1.8 channels. The smooth curves haveV0.5 and k values for activation of 4.7 ± 0.7 and 6.8 ± 0.1 mV for Nav1.8 (filled circles;n = 8) and −3.3 ± 1.0 and 5.5 ± 0.1 mV for Nav1.8+β1 (open circles;n = 9). The V0.5 andk values for inactivation are −54.8 ± 1.7 and 8.4 ± 0.2 mV for Nav1.8 (n = 3) and −62.6 ± 2.3 and 6.3 ± 0.7 mV for Nav1.8+β1 (n = 6).C, D, The time course of recovery from inactivation of Nav1.7 and Nav1.8 channels. Inactivation was induced by depolarizing to −20 mV (Nav1.7 and Nav1.7+β1) or +20 mV (Nav1.8 and Nav1.8+β1) for 50 msec before returning to −100 mV for intervals between 1 msec and 5 sec. A standard test pulse was used to monitor recovery, and the normalized test currents were plotted versus the recovery interval.C, Recovery from inactivation of Nav1.7 (filled squares) and Nav1.7+β1 (open squares) channels. The smooth curves are fits to the sum of two exponentials:I/IO =AF · (1 − exp(−tF)) +AS · (1 − exp(−tS)), with time constants (τ) and weighting factors (A) of 19.6 ± 0.8 msec (τF;AF = 0.46 ± 0.02) and 933.4 ± 54.6 msec (τS;AS = 0.54 ± 0.02) for Nav1.7 (n = 7) and 6.6 ± 0.6 msec (τF; AF = 0.89 ± 0.02) and 53.2 ± 12.7 msec (τS;AS = 0.11 ± 0.02) for Nav1.7+β1 (n = 7).D, The recovery of Nav1.8 (filled circles) and Nav1.8+β1 (open circles) channels is described best by the sum of three exponentials:I/IO =AF · (1 − exp(−tF)) +AI · (1 − exp(−tI)) +AS · (1 − exp(−tS)), where τF, τI, and τSare the fast, intermediate, and slow recovery time constants, andAF,AI, and ASare the relative weighting factors. t is the interpulse duration, and I/Io is the normalized current amplitude. Data are the means ± SEM. The time constants of Nav1.8 are 9.9 ± 1.8 msec (τF; AF = 0.41 ± 0.04), 168.6 ± 52.2 msec (τI;AI = 0.28 ± 0.04), and 787.6 ± 112.6 msec (τS;AS = 0.28 ± 0.04) (filled circles; n = 5). Recovery time constants of Nav1.8+β1 are 2.0 ± 0.3 msec (τF;AF = 0.32 ± 0.05), 243.8 ± 85.4 msec (τI; AI= 0.34 ± 0.05), and 1070.1 ± 59.0 msec (τS; AS = 0.34 ± 0.02) (open circles; n= 4).
Fig. 6.
Fig. 6.
Development of slow inactivation of Nav1.7+β1 and Nav1.8+β1 sodium channels. Time course of entry into the slow inactivated state was measured by using a triple-pulse protocol consisting of a variable duration conditioning pulse (2 msec to 10 sec) to −20 mV (Nav1.7+β1; open squares) or to +20 mV (Nav1.8+β1; open circles) to inactivate the channels. A 20 msec pulse to −100 mV was applied to promote the rapid recovery of inactivated channels, and a standard test pulse was used to assay availability. The test currents were normalized and plotted versus the conditioning pulse interval. The decay of the currents is fit best by the sum of three exponentials: I/IO= AF · (1 − exp(−tF)) +AI · (1 − exp(−tI)) +AS · (1 − exp(−tS)), where τF, τI, and τSare the time constants, and AF,AI, and ASare the relative weighting factors. t is the conditioning pulse duration, andI/Io is the normalized current. The data are the means ± SEM. The time constants of Nav1.7+β1 (open squares) are τF = 32.6 ± 1.5 msec (AF = 0.25 ± 0.03), τI = 556.5 ± 104.4 msec (AI = 0.33 ± 0.02), and τS = 4071.9 ± 155.1 msec (AS = 0.42 ± 0.03) (n = 6). For Nav1.8+β1(open circles) the time constants are τF = 8.4 ± 1.5 msec (AF = 0.57 ± 0.07), τI = 200.0 ± 30.0 msec (AI = 0.16 ± 0.07), and τS = 8880.0 ± 1150.0 msec (AS = 0.27 ± 0.04) (n = 5).
Fig. 7.
Fig. 7.
Frequency-dependent inhibition of Nav1.7+β1 and Nav1.8+β1 sodium currents. A,B, A train of 50 pulses was applied to −20 mV (Nav1.7+β1; n = 11) or +20 mV (Nav1.8+β1;n = 8) at frequencies between 0.5 and 100 Hz. The peak currents elicited by each test pulse were normalized to the current of the first pulse (Pn/P1, where n = 1–50) and were plotted versus pulse number. The pulse duration was 8 msec for frequencies between 0.5 and 50 Hz but was reduced to 5 msec for the 100 Hz experiments. The holding and interpulse potential was −100 mV. C, Plotted is the ratio of the currents elicited by the 50th and first pulses (P50/P1) versus the pulsing frequency. Insets are representative raw current traces of Nav1.7+β1 (open squares) and Nav1.8+β1 (open circles) stimulated at 20 Hz.

Similar articles

Cited by

References

    1. Akopian AN, Sivilotti L, Wood JN. A tetrodotoxin-resistant voltage-gated sodium channel expressed by sensory neurons. Nature. 1996;379:257–262. - PubMed
    1. Arbuckle JB, Docherty RJ. Expression of tetrodotoxin-resistant sodium channels in capsaicin-sensitive dorsal root ganglion neurons of adult rats. Neurosci Lett. 1995;185:70–73. - PubMed
    1. Auld VJ, Goldin AL, Krafte DS, Marshall J, Dunn JM, Catterall WA, Lester HA, Davidson N, Dunn RJ. A rat brain Na+ channel α subunit with novel gating properties. Neuron. 1988;1:449–461. - PubMed
    1. Bennett PB, Jr, Makita N, George AL., Jr A molecular basis for gating mode transitions in human skeletal muscle Na+ channels. FEBS Lett. 1993;326:21–24. - PubMed
    1. Black JA, Dib-Hajj S, McNabola K, Jeste S, Rizzo MA, Kocsis JD, Waxman SG. Spinal sensory neurons express multiple sodium channel α subunit mRNAs. Brain Res Mol Brain Res. 1996;43:117–131. - PubMed

Publication types

MeSH terms

LinkOut - more resources