. 2001 Oct 15;21(20):7969-84.
doi: 10.1523/JNEUROSCI.21-20-07969.2001.

An evaluation of synapse independence

Affiliations

An evaluation of synapse independence

B Barbour. J Neurosci. .

Abstract

If, as is widely believed, information is stored in the brain as distributed modifications of synaptic efficacy, it can be argued that the storage capacity of the brain will be maximized if the number of synapses that operate independently is as large as possible. The majority of synapses in the brain are glutamatergic; their independence will be compromised if glutamate released at one synapse can significantly activate receptors at neighboring synapses. There is currently no agreement on whether "spillover" after the liberation of a vesicle will significantly activate receptors at neighboring synapses. To evaluate the independence of central synapses, it is necessary to compare synaptic responses with those generated at neighboring synapses by glutamate spillover. Here, synaptic activation and spillover responses are simulated in a model, based on data for hippocampal synapses, that includes an approximate representation of the extrasynaptic space. Recently-published data on glutamate transporter distribution and properties are incorporated. Factors likely to influence synaptic or spillover responses are investigated. For release of one vesicle, it is estimated that the mean response at the nearest neighboring synapse will be <5% of the synaptic response. It is concluded that synapses can operate independently.


Figures
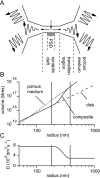
Fig. 1.
Fig. 1.
Representation of the synaptic cleft and perisynaptic region. A, Schematic representing the three different regions in the model. A disk-like synaptic cleft formed by the apposition of the presynaptic and postsynaptic elements contains a central PSD. A transition region extends from the cleft edge to a porous medium representing the bulk extracellular tissue.B, The extracellular volume, V, enclosed as a function of the radius, r, from the center of the model. Within the synaptic cleft the volume increases according to the law for the disk (cylindrical) geometry: V = πr2h (dashed line; h = 20 nm). A different law pertains for the three-dimensional porous medium that represents the distant extracellular space: V = α4πr3/3 (dotted line; α = 0.2). In the model a composite volume function (solid line) was constructed by joining an inner disk-like region to an outer porous medium-like region via a smooth transition region of 200 nm between the radii of 180 and 380 nm (indicated by the pair of vertical lines). C, In the porous medium, part of the model an effective diffusion coefficient (D) was used that was in general different to that used for the synaptic cleft (which was in most cases the diffusion coefficient for free medium). A smooth transition, analogous to that above for the volume function, was effected between these two regimes.
Fig. 2.
Fig. 2.
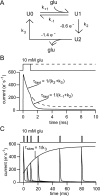
A simple glutamate transporter model including a fast “trapping” reaction. A, Reaction scheme for the transporter model used. The reaction with rate constantk2 represents the rapid trapping (probably by translocation) of bound glutamate. B, Simulated experiment in which rapid glutamate applications and measurement of transporter currents are used to determine the rate constants of the model from the “deactivation” and “desensitization” time constants. The glutamate concentration was 10 mm. The current is given in electronic charges per second per transporter and was calculated by assuming that two charges per cycle were divided between the reactions as shown in A. The choice made has no influence on the subsequent simulations of the effect of uptake on receptor activation. C, Simulated experiment showing determination of the recovery time constant (or cycling time). Pairs of brief applications (10 mm, 1 msec) were applied with different intervals, the first application being att = 0.
Fig. 3.
Fig. 3.
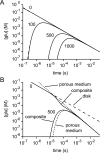
Verification of the diffusion section of the model. A, With a volume function representing an infinite disk, the glutamate concentration time courses at various radii (0, 100, 500, and 1000 nm) predicted by the model (solid lines) gave satisfactory fits to the corresponding analytical solutions (dashed lines, superimposed).B, With the composite volume function and variable diffusion coefficient of Figure 1 the numerical solutions (solid lines) for the glutamate concentration time courses atr = 0 and r = 500 nm eventually approach the analytical solutions for a porous medium (dotted lines). This behavior is expected, because of the tendency of diffusion to “forget” the initial conditions of release. In the composite structure, the time course at r = 0 initially follows the analytical solution for a disk (dashed line) before later approaching the analytical porous medium solution.
Fig. 4.
Fig. 4.
Receptor activation depends on geometry and the diffusion coefficient. A, B, Calculated average synaptic AMPA (A) and NMDA (B) receptor responses to release of one vesicle of glutamate for different combinations of geometry and diffusion coefficient. The composite model (solid line; geometry and D as in Fig. 1) is compared with an infinite disk with two values of diffusion coefficient (D = 7.6 × 10⁻⁸ dm2/sec,dashed line; D = 3 × 10⁻⁸ dm2/sec, dot-dashed line) and with an open volume surrounding the synapse (D = 7.6 × 10⁻⁸dm2/sec; transition region = 200 nm; α = 1; λ = 1; dotted line). C,D, Estimation of the effect of spillover. AMPA (C) and NMDA (D) receptor responses in the composite geometry (solid lines) at distances of 500 nm and 1 μm (the smaller responses). The responses in the composite medium are very similar to those of the receptors driven by the glutamate concentration given by the analytical solution for diffusion from an instantaneous point source in a porous medium with α = 0.2 and λ = 1.6 (dashed lines).
Fig. 5.
Fig. 5.
Adding “generic” glutamate binding sites improves synaptic independence. Simple binding sites withKd values of 100 μm(dotted lines), 10 μm (dashed lines), or 1 μm (dot-dashed lines) were added throughout the model at a concentration of 100 μm in the extracellular space (20 μm tissue concentration). The synaptic responses (A, B) and spillover responses at 500 nm (C, D) of AMPA (A, C) and NMDA (B, D) receptors are shown, compared with the control situation in the absence of binding sites (solid lines).
Fig. 6.
Fig. 6.
Glutamate transporters selectively limit spillover. A, B, The effects of zero (solid lines), 25 μm (dashed lines), or 5 μm (dotted lines) transporters on synaptic (A) and spillover (500 nm; B) NMDA receptor responses. Transporters were distributed uniformly outside the synaptic cleft; their concentrations are with respect to tissue volume. C, Release of a single vesicle does not saturate nearby transporters (present at 25 μm). Solid line, 200 nm; dotted line, 300 nm; dashed line, 500 nm; anddot-dashed line, 1 μm. Subsequent simulations, unless otherwise stated, are in the presence of 25 μmtransporters outside the synaptic cleft.
Fig. 7.
Fig. 7.
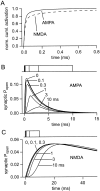
Timing of glutamate release and receptor activation. A, Receptor activation is terminated very rapidly. Curves showing when synaptic AMPA (solid line) and NMDA (dashed line) receptors are activated, defined as binding a second glutamate molecule (see Results). The curves represent the cumulative fraction of all activations (up to 50 msec) occurring after instantaneous release of a single vesicle.B, C, Slow glutamate release reduces AMPA responses and delays NMDA responses. Families of synaptic AMPA (B) and NMDA (C) receptor responses to the instantaneous release of a vesicle (“0”) or to release of the contents of one vesicle at a uniform rate over 0.1, 0.3, 1, 3 or 10 msec (timing indicated above each panel).
Fig. 8.
Fig. 8.
Multivesicular release impairs synaptic independence. Synaptic (A, B) and spillover (500 nm;C, D), AMPA (A, C), and NMDA (B, D) receptor responses are shown for the release of 1, 2, 3, 4, and 5 vesicles containing 5000 molecules of glutamate each (more vesicles give larger responses in all cases). The spillover/synaptic response ratio rises as more vesicles are released.
Fig. 9.
Fig. 9.
Obstructions to diffusion in the synaptic cleft increase synaptic independence. Possible submicroscopic obstacles to diffusion within the synaptic cleft were modeled by setting the volume fraction and tortuosity of the synaptic cleft to the following pairs of values: αcleft = 1, λcleft = 1 (ctrl, unimpeded diffusion); αcleft = 0.7, λcleft = 1.3; αcleft = 0.3, λcleft = 1.7; αcleft = 0.1, λcleft = 1.9. Increased synaptic AMPA (A), and NMDA (B) responses are observed as α is decreased and λ is increased, but spillover responses (500 nm; C, D) are unchanged.
Fig. 10.
Fig. 10.
A single vesicle desensitizes a small fraction of synaptic AMPA receptors. Simulated synaptic paired-pulse experiment, showing the amplitudes of synaptic responses to successive vesicle liberations separated by 10, 20, 50, and 100 msec. The peak effect of desensitization causes a 15% reduction in synaptic AMPA receptorPopen for the second vesicle.
Fig. 11.
Fig. 11.
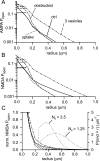
Assessing synaptic independence.A, Peak AMPA receptor Popenas a function of distance under a variety of conditions: a single vesicle with no uptake (solid; ctrl), with uptake (25 μm transporters; dotted,uptake), three vesicles (with 25 μmtransporters; dot-dashed, 3 vesicles), and with obstructions to diffusion in the synaptic cleft (αcleft = 0.7, λcleft = 1.3; one vesicle with 25 μm transporters; dashed,obstructed). The average peak synapticPopen values are represented by thehorizontal line segments in the top leftcorner of the graph. The synaptic responses in descending order are: 3 vesicles, obstructed, ctrl ≈ uptake. B, Analogous plot for NMDA receptors. Same key as in A.C, The Popen curves fromB for NMDA receptors are replotted (left axis; same key as in A) after normalization to the average synaptic Popen in each condition (horizontal line segment top left). Two probability density functions (lightly dotted lines) for the distance to the nearest neighbor synapse are plotted (right axis) and labeled with the corresponding densities:Nv = 3.5 synapses μm−3 or Nv = 1.25 synapses μm−3. nnd, Nearest neighbor distance.
Fig. 12.
Fig. 12.
Comparison with reported glutamate concentration time courses. A, Glutamate time courses determined using low-affinity glutamate receptor antagonists are slower than predicted here. The difference is difficult to account for only by slowing diffusion within the synaptic cleft. Time courses reported by: Clements et al. (1992) (CLTJW 1; dashed line); Clements (1996)(CLTJW 2; dashed curve); Diamond and Jahr (1997)(DJ1,2; dotted). The predictions of the present model (solid lines, average concentration over the PSD) are for instantaneous release of one vesicle in the absence of transporters (ctrl), and the same but with an extreme obstruction of the synaptic cleft (obstructed; αcleft = 0.1, λcleft = 1.9). The peak concentrations for ctrl and obstructed time courses are 10.9 and 109 mm, respectively. B, There is a discrepancy between the glutamate time courses reported by Rusakov and Kullmann (1998b) and Rusakov et al. (1999) and the present simulations, which agree with an approximate theoretical prediction. The glutamate concentration at 300 nm reported by Rusakov and Kullmann (RK; dot-dashed line) is approximately twice that produced using very similar parameters in the present simulation (dashed line). The accuracy of the present simulation is confirmed by its close agreement with the analytical solution for diffusion from a point source in a porous medium (dotted line). Some of the (slight) difference between the present simulation and the analytical solution is attributable to the presence of transporters, because a similar simulation without transporters (solid line) agrees even more closely with the analytical solution.

Similar articles

Cited by

References

    1. Auger C, Attwell D. Fast removal of synaptic glutamate by postsynaptic transporters. Neuron. 2000;28:547–558. - PubMed
    1. Auger C, Kondo S, Marty A. Multivesicular release at single functional synaptic sites in cerebellar stellate and basket cells. J Neurosci. 1998;18:4532–4547. - PMC - PubMed
    1. Barbour B, Häusser M. Intersynaptic diffusion of neurotransmitter. Trends Neurosci. 1997;20:377–384. - PubMed
    1. Barbour B, Keller BU, Llano I, Marty A. Prolonged presence of glutamate during excitatory transmission to cerebellar Purkinje cells. Neuron. 1994;12:1331–1343. - PubMed
    1. Bergles DE, Jahr CE. Synaptic activation of glutamate transporters in hippocampal astrocytes. Neuron. 1997;19:1297–1308. - PubMed

MeSH terms

Substances

LinkOut - more resources