. 2001 Oct 15;21(20):8015-25.
doi: 10.1523/JNEUROSCI.21-20-08015.2001.

Induction of mossy fiber --> Ca3 long-term potentiation requires translocation of synaptically released Zn2+

Affiliations

Induction of mossy fiber --> Ca3 long-term potentiation requires translocation of synaptically released Zn2+

Y Li et al. J Neurosci. .

Abstract

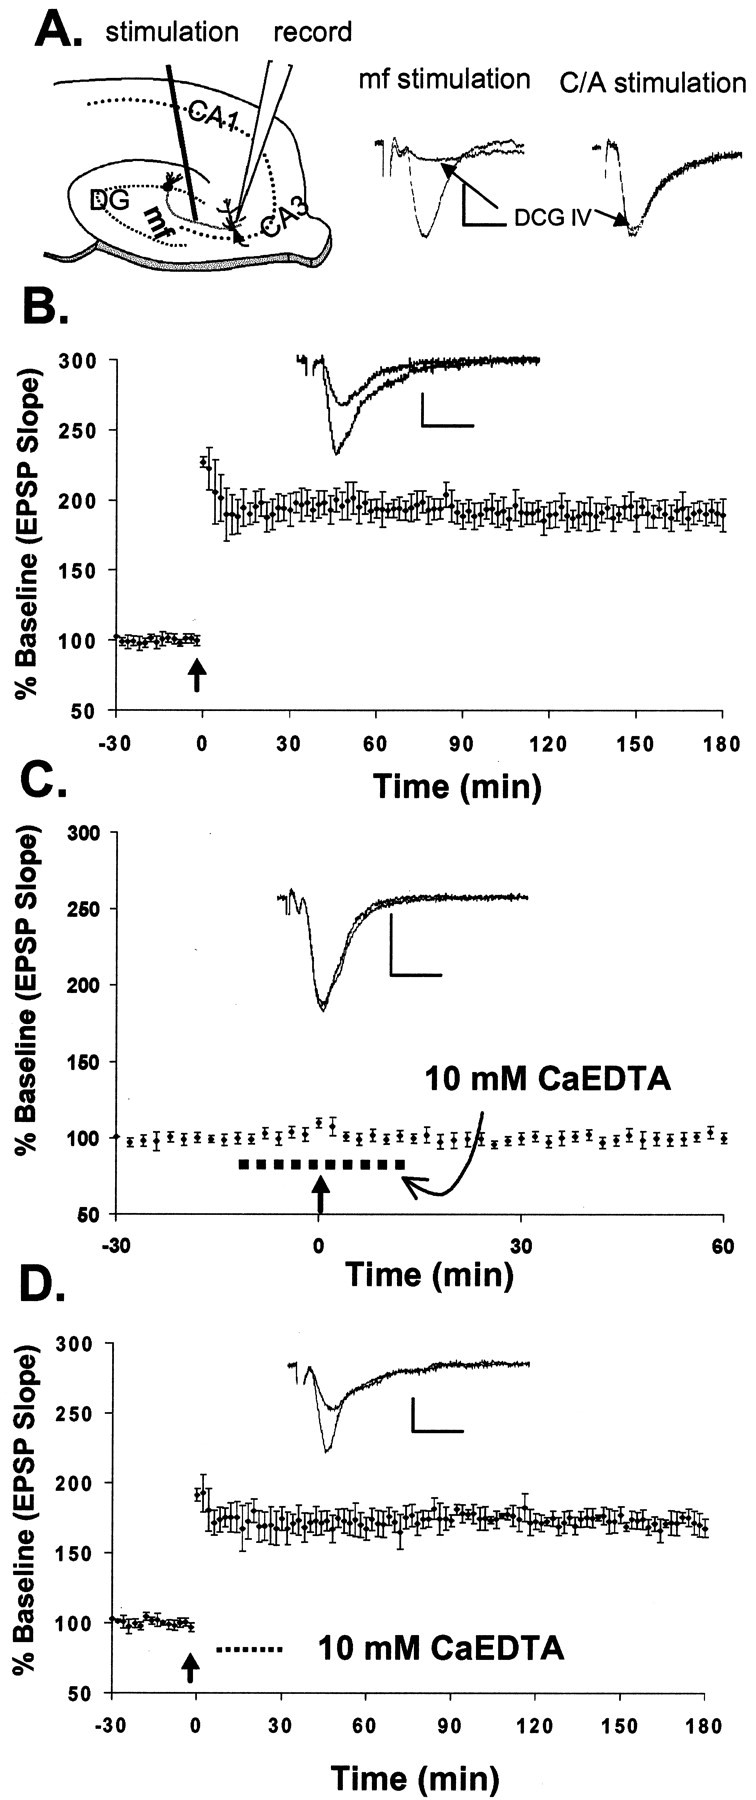
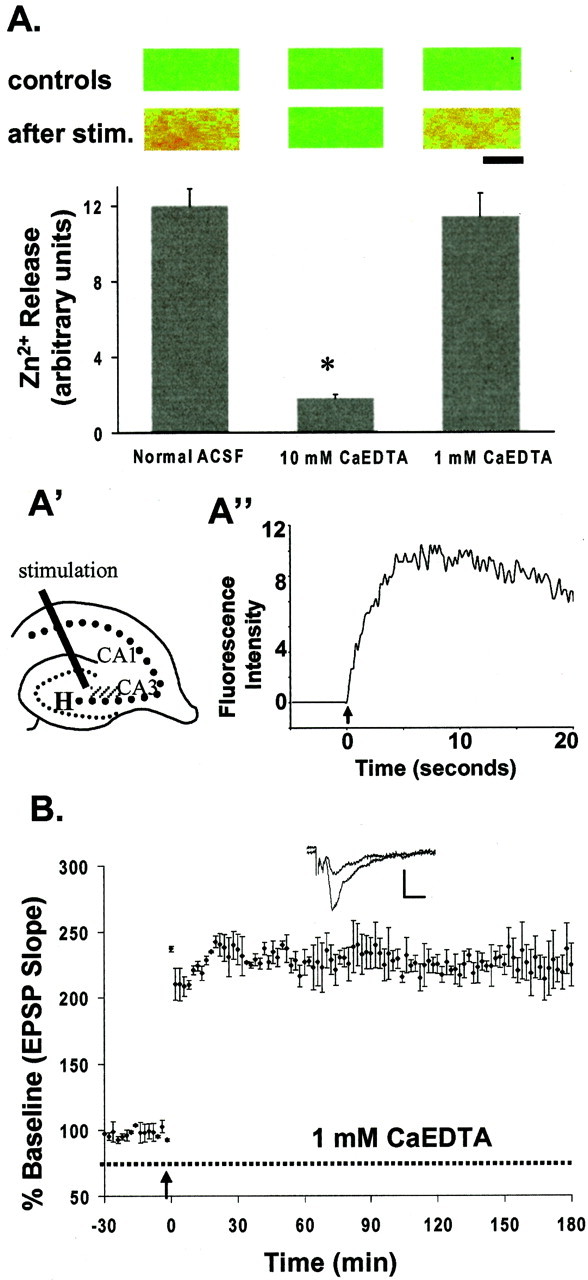
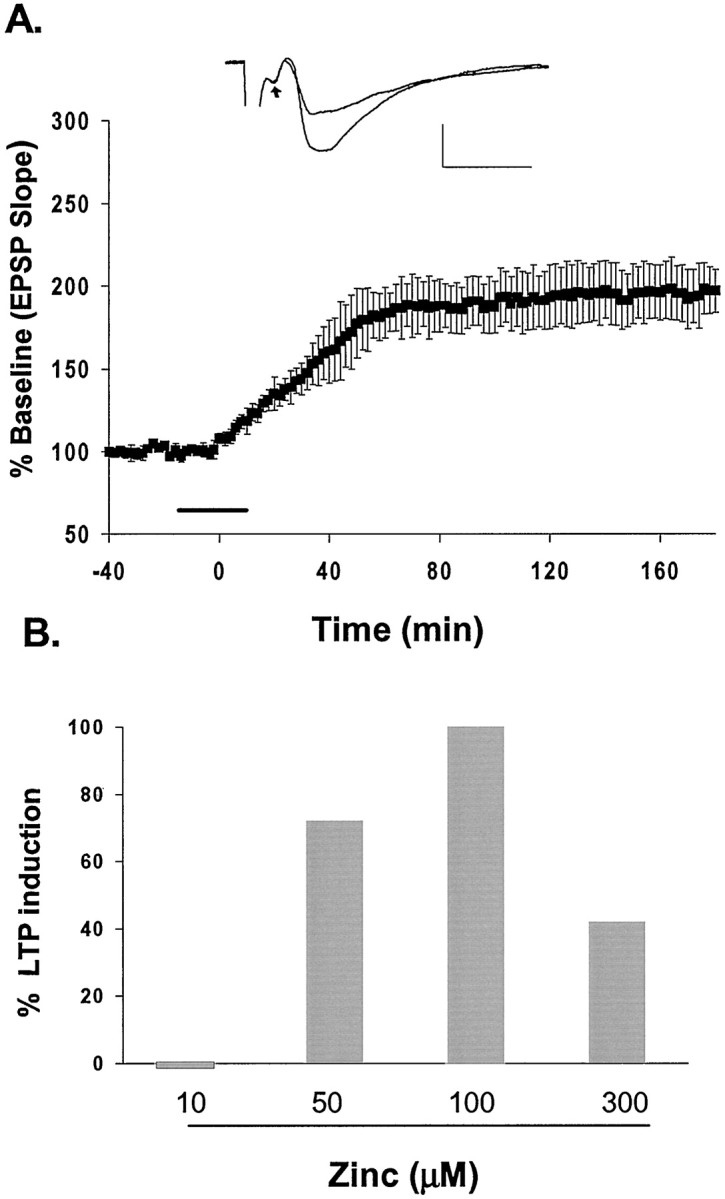
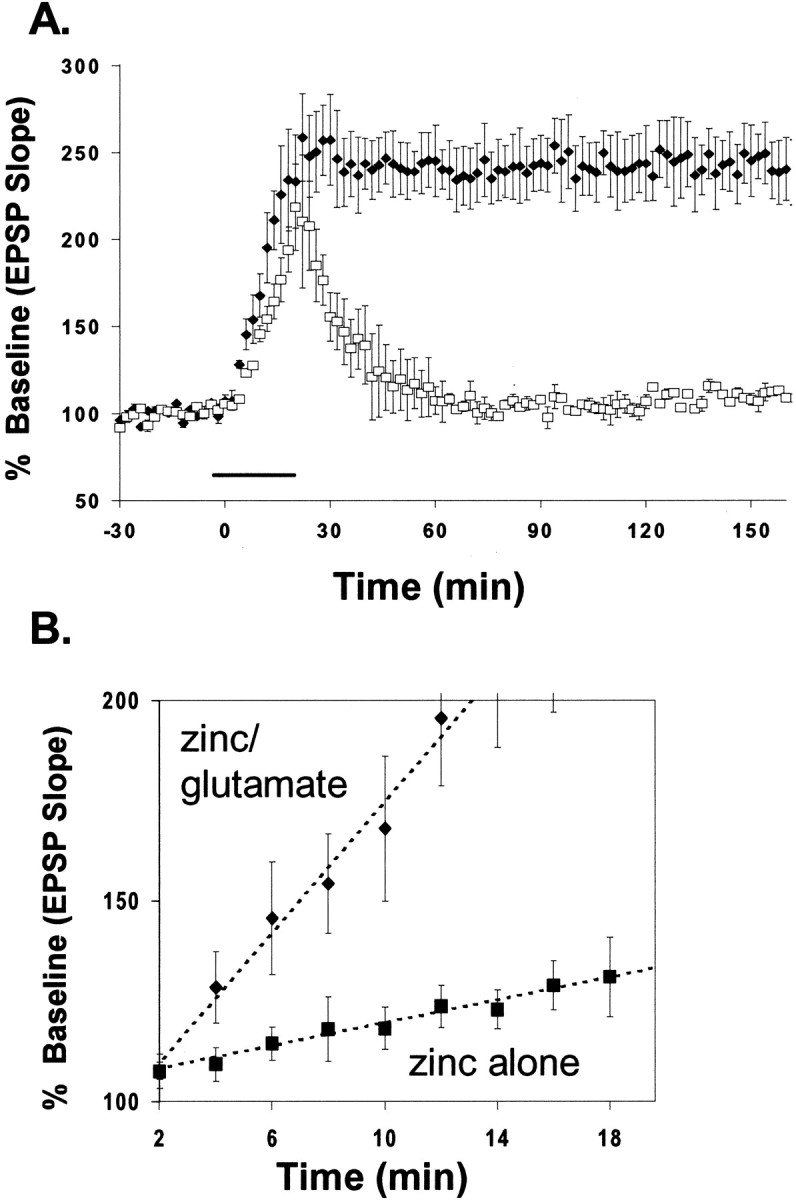
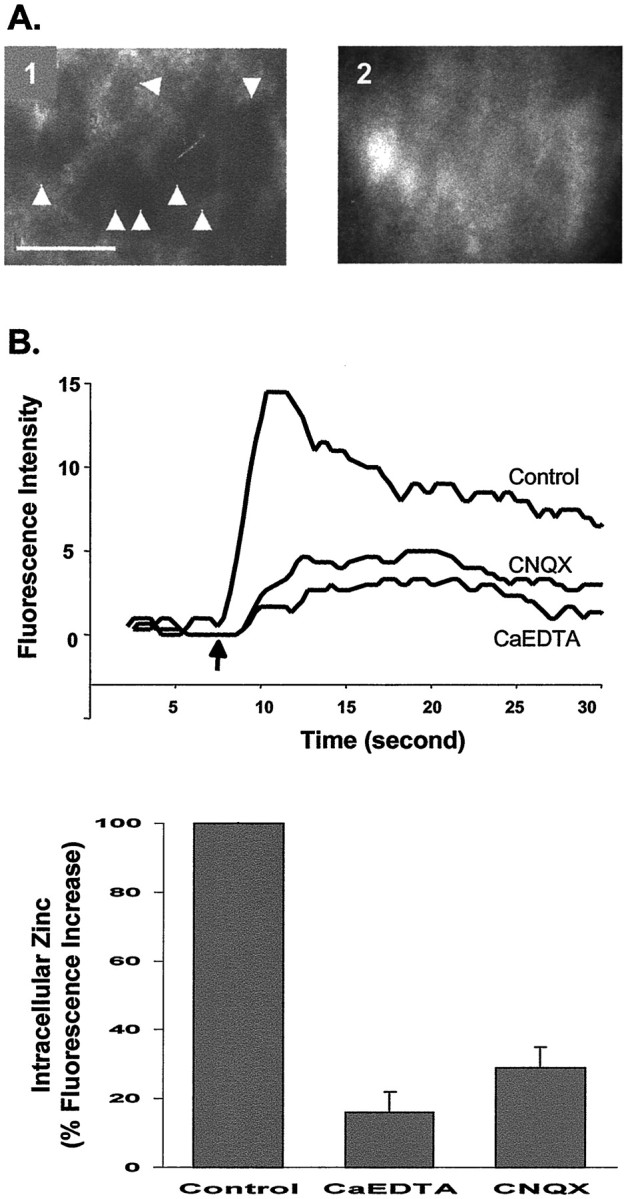
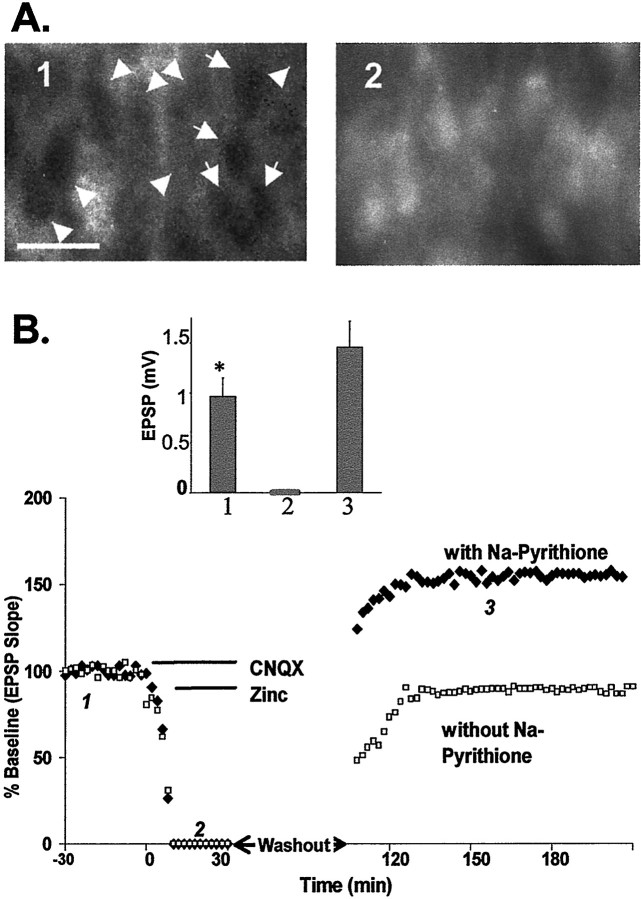
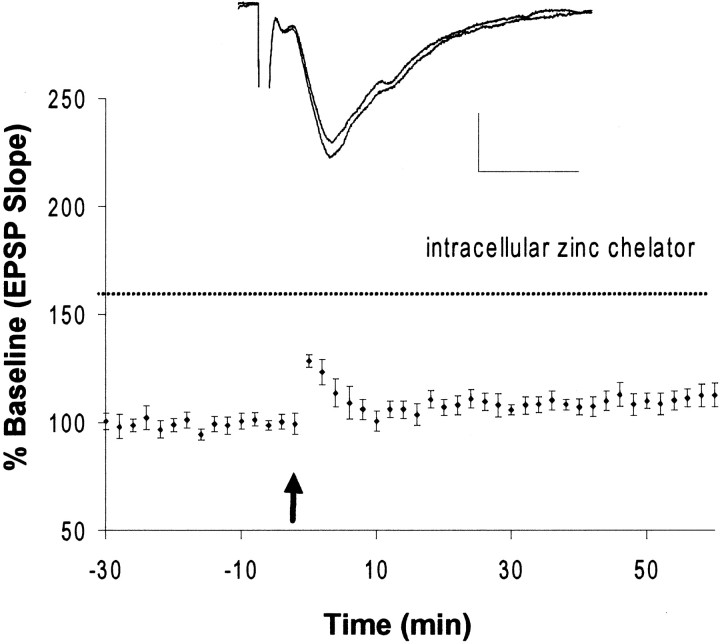
The mammalian CNS contains an abundance of chelatable Zn(2+) sequestered in the vesicles of glutamatergic terminals. These vesicles are particularly numerous in hippocampal mossy fiber synapses of the hilar and CA3 regions. Our recent observation of frequency-dependent Zn(2+) release from mossy fiber synaptic terminals and subsequent entry into postsynaptic neurons has prompted us to investigate the role of synaptically released Zn(2+) in the induction of long-term potentiation (LTP) in field CA3 of the hippocampus. The rapid removal of synaptically released Zn(2+) with the membrane-impermeable Zn(2+) chelator CaEDTA (10 mm) blocked induction of NMDA receptor-independent mossy fiber LTP by high-frequency electrical stimulation (HFS) in rat hippocampal slices. Mimicking Zn(2+) release by bath application of Zn(2+) (50-100 microm) without HFS induced a long-lasting potentiation of synaptic transmission that lasted more than 3 hr. Moreover, our experiments indicate the effects of Zn(2+) were not attributable to its interaction with extracellular membrane proteins but required its entry into presynaptic or postsynaptic neurons. Co-released glutamate is also essential for induction of LTP under physiological conditions, in part because it allows Zn(2+) entry into postsynaptic neurons. These results indicate that synaptically released Zn(2+), acting as a second messenger, is necessary for the induction of LTP at mossy fiber-->CA3 synapses of hippocampus.


Figures

Fig. 1.
Fig. 1.
Rapid chelation of extracellular Zn2+ blocks induction of mossy fiber LTP.A, Schematic of a hippocampal slice showing stimulating and recording sites. The traces on theright show the field EPSPs evoked by stimulation of mossy fibers (mf) and the commissural–associational pathway. The group II mGluR agonist DCG-IV (5 μm) selectively blocked mossy fiber responses to 17.3 ± 2% (n = 6) of those before drug application but had little effect on the responses (to 97.7 ± 1.9%; n = 6) evoked by stimulating the commissural–associational fibers in the stratum radiatum (electrode not shown). B, Mossy fiber LTP (193 ± 10%; n = 9) induced by HFS after recording a 30 min baseline (see Materials and Methods).C, HFS failed to induce mossy fiber LTP (103 ± 4%; n = 11) in the presence of 10 mmCaEDTA (dashed line). D, Adding CaEDTA (10 mm;dashed line) 10 min after induction of LTP did not affect the late, or maintenance, phase of LTP (175 ± 8%; n = 3). Each point inB–D represents the averaged and normalized EPSP initial negative slope, and error bars indicate SEM. Arrowsindicate HFS (100 Hz, 2 sec). B–D, Insets, EPSP recorded during baseline and at the end of the recording period after HFS. Calibration: 1.0 mV, 5 msec.
Fig. 2.
Fig. 2.
Zn2+ release with electrical stimulation and the effects of Zn2+ chelator.A, Extracellular Zn2+ released from terminals after electrical stimulation (stim.) was measured as the peak emission intensity of extracellular Newport Green fluorescence in the absence and presence of Zn2+chelator (3 determinations; error bars indicate SE). The paired images on top correspond with each condition of the bar graph. They were acquired before (controls in the first row) and after (second row) HFS (200 μsec, 0.5 mA pulses for 5 sec). In these false-color images, increasing intensity of Zn2+ fluorescence is represented by the spectrum ranging from blue (the lowest) to red(the highest). Scale bar, 100 μm. A', Thehatched area represents the region where images were acquired. H, Hilus. Values plotted are the mean ± SEM; n = 4; *p < 0.05.A“, Plot of electrical stimulation (100 Hz for 5 sec)-evoked rapid release of Zn2+ from neuronal terminals measured by changes in Newport Green fluo- rescence intensity (arbitrary units). Thearrow indicates the beginning of stimulation.B, A low concentration of CaEDTA (1 mm;dashed line) had little effect on mossy fiber LTP (227 ± 11%; n = 4) evoked by HFS. Eachpoint is the averaged and normalized EPSP initial negative slope, and error bars indicate SEM. Arrowsindicate the time giving HFS (100 Hz, 2 sec). Calibration: 1.0 mV, 5 msec.
Fig. 3.
Fig. 3.
Calculated kinetics of chelation of 100 μm Zn2+ in ACSF by 1 and 10 mm CaEDTA. The rate of chelation of 100 μmZn2+ by 1 and 10 mm CaEDTA was estimated using published and estimated forward and reverse rate constants as described in . Only the first 0.1 msec after the release of Zn2+ is given. Equilibrium conditions are assumed for 1 and 10 mm CaEDTA in ACSF in the absence of Zn2+ at time 0. Note that, under these conditions, equilibrium concentrations after introduction of 100 μmZn2+ are not achieved within this time frame.
Fig. 4.
Fig. 4.
Exposure of slices to a high concentration of CaEDTA does not alter normal basal synaptic responses at mossy fiber→CA3 synapses with low-frequency stimulation. A, Free Ca2+ was measured in normal ACSF (left bar) and in ACSF containing 10 mm CaEDTA (middle bar). The right bar shows the concentration of Ca2+ measured in ACSF containing 10 mm CaEDTA with an additional 0.22 mmCaCl2 (2.4 mm CaCl2 in normal ACSF) added to restore free Ca2+ to the level in normal ACSF. B, Plot of the EPSP against time, with bath-applied CaEDTA (10 mm) indicated by a dashed line. Each point represents the averaged initial slope of evoked EPSP (n = 6). The averaged values were then normalized to the mean initial slope during 30 min baseline recording (percent ± SEM). The traces ontop represent recording before (1) and during (2) CaEDTA perfusion.C, The paired pulse ratio is unaffected by the addition of CaEDTA, as shown on the left. The bar graph demonstrates the average paired pulse ratios from six recordings in which two stimuli were given 40 msec apart in the presence and absence of CaEDTA. Calibration in B, C: 0.5 mV, 5 msec.
Fig. 5.
Fig. 5.
Exogenous Zn2+ induces long-lasting potentiation of the EPSP. A, Plot of exogenous Zn2+-induced long-lasting potentiation. Zn2+ (100 μm) was applied for 20 min (line) after recording a 30 min baseline. Application of Zn2+ was followed by wash with 10 mmCaEDTA. Inset, EPSP recorded before and after exposure to Zn2+. Note that the afferent volley (arrow) was not affected. B, Percentage of LTP induced by different concentrations of exogenous Zn2+. Calibration in A: 1.0 mV, 5 msec.
Fig. 6.
Fig. 6.
Glutamate facilitates the potentiating effect of Zn2+. A, Co-application of glutamate (100 μm) and Zn2+ (100 μm) expeditiously potentiated EPSPs; potentiation lasted several hours (filled diamonds). Glutamate alone (open squares; in the presence of CaEDTA) failed to induce long-lasting potentiation of the EPSP. Exogenous glutamate and Zn2+ were applied for 20 min (line) after recording a 30 min baseline. Application of glutamate or Zn2+ with glutamate was followed by wash with 10 mm CaEDTA. B, Comparison of the rate of onset of long-lasting potentiation induced by Zn2+alone and Zn2+ plus glutamate. Eachpoint represents the averaged, normalized EPSP initial slope ± SEM from data in Figure 5A andA, respectively.
Fig. 7.
Fig. 7.
Increase of intracellular Zn2+after HFS. A, Paired images of the pyramidal layer of CA3 taken with a 63× water immersion objective lens. Electrical stimulation increased intracellular Zn2+ in the CA3 region of hippocampal slices loaded with Newport Green diacetate (cell-permeable). Before stimulation (1), no cell bodies were labeled; they became visible (2) after stimulation (100 Hz, 500 μA for 10 sec). Scale bar, 50 μm;arrowheads indicate pyramidal cell bodies.B, Intracellular Zn2+ was detected with the fluorescence indicator Newport Green diacetate in normal ACSF and ACSF containing CaEDTA (10 mm) or CNQX (10 μm). The results are plotted on the left. the arrow indicates the beginning of stimulation. Thebar graph on the right summarizes the effects of CaEDTA (n = 5) and CNQX (n = 3) on the increase in intracellular Zn2+ after electrical stimulation, expressed as percentage of control. Error bars indicate SEM.
Fig. 8.
Fig. 8.
Potentiation of the EPSP requires entry of Zn2+ into cells. A, Paired images of the pyramidal layer of CA3 (taken with a 63× objective lens) loaded with Newport Green diacetate before (1) and after (2) exposure to Zn2+ (100 μm), Na-pyrithione (50 μm), and CNQX (10 μm). Scale bar, 50 μm; arrowheadsindicate pyramidal cell bodies. B, Plot of the EPSP slope from a representative experiment to show that selectively increasing intracellular Zn2+ potentiates the EPSP (158 ± 12%; n = 4; filled diamonds). Zn2+ (100 μm) and Na-pyrithione (50 μm) were applied after the EPSP was blocked by CNQX (10 μm). In a similar experiment without Na-pyrithione, no EPSP potentiation was observed (93 ± 9%;n = 4; open squares).Lines indicate the duration of drug application.Inset, Summary of four experiments in which slices were treated with Na-pyrithione and Zn2+. Values of the EPSP amplitude were taken from baseline (1), in the presence of CNQX (2), and during EPSP potentiation (3). Numberscorrespond to those in B. *Significant difference (p < 0.05) between 1 and3.
Fig. 9.
Fig. 9.
Intracellular Zn2+ chelator blocks the induction of LTP. HFS failed to induce mossy fiber LTP (110 ± 4.5%; n = 4) in slices loaded with intracellular Newport Green, which was used here as a selective intracellular Zn2+ chelator (dashed line). Each point represents the averaged and normalized EPSP initial negative slope, and error bars indicate SEM.Inset, EPSP recorded during baseline and at the end of recording after HFS. The arrow indicates HFS (100 Hz, 2 sec). Calibration: 1.0 mV, 5 msec.

Similar articles

Cited by

References

    1. Aniksztejn L, Charton G, Ben-Ari Y. Selective release of endogenous zinc from the hippocampal mossy fibers in situ. Brain Res. 1987;404:58–64. - PubMed
    1. Assaf SY, Chung SH. Release of endogenous Zn2+ from brain tissue during activity. Nature. 1984;308:734–736. - PubMed
    1. Basolo F, Pearson RG. Mechanisms of inorganic reactions; a study of metal complexes in solution, Ed 2. Wiley; New York: 1967.
    1. Bers DM, Patton CW, Nuccitelli R. A practical guide to the preparation of Ca2+ buffers. Methods Cell Biol. 1994;40:3–29. - PubMed
    1. Bortolotto ZA, Clarke VR, Delany CM, Parry MC, Smolders I, Vignes M, Ho KH, Miu P, Brinton BT, Fantaske R, Ogden A, Gates M, Ornstein PL, Lodge D, Bleakman D, Collingridge GL. Kainate receptors are involved in synaptic plasticity. Nature. 1999;402:297–301. - PubMed

Publication types

MeSH terms

LinkOut - more resources