. 2001 Oct 15;21(20):8091-107.
doi: 10.1523/JNEUROSCI.21-20-08091.2001.

Rna-binding protein Musashi2: developmentally regulated expression in neural precursor cells and subpopulations of neurons in mammalian CNS

Affiliations

Rna-binding protein Musashi2: developmentally regulated expression in neural precursor cells and subpopulations of neurons in mammalian CNS

S Sakakibara et al. J Neurosci. .

Abstract

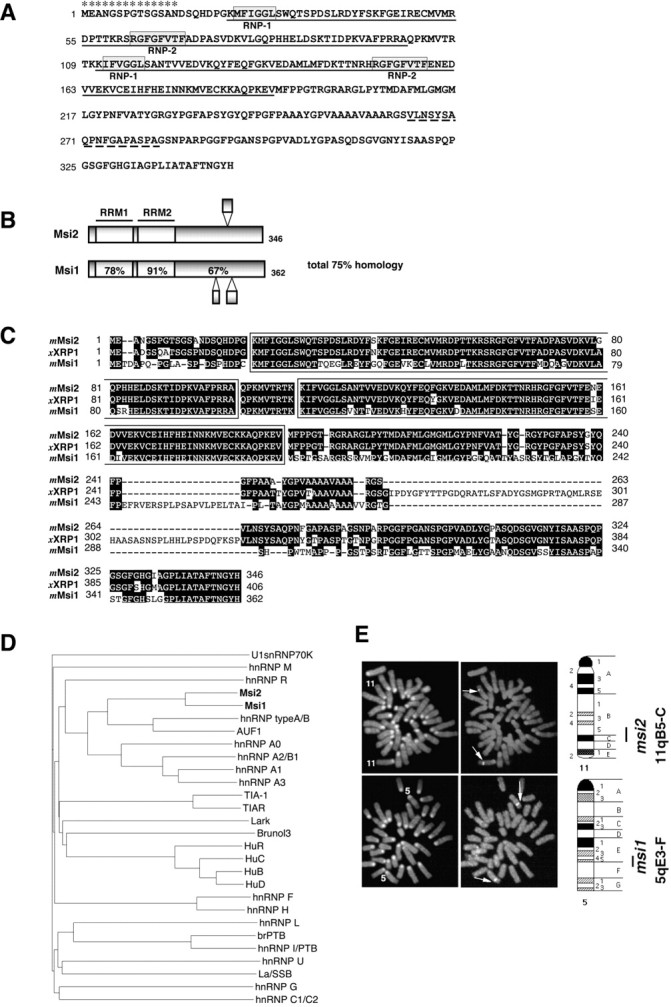
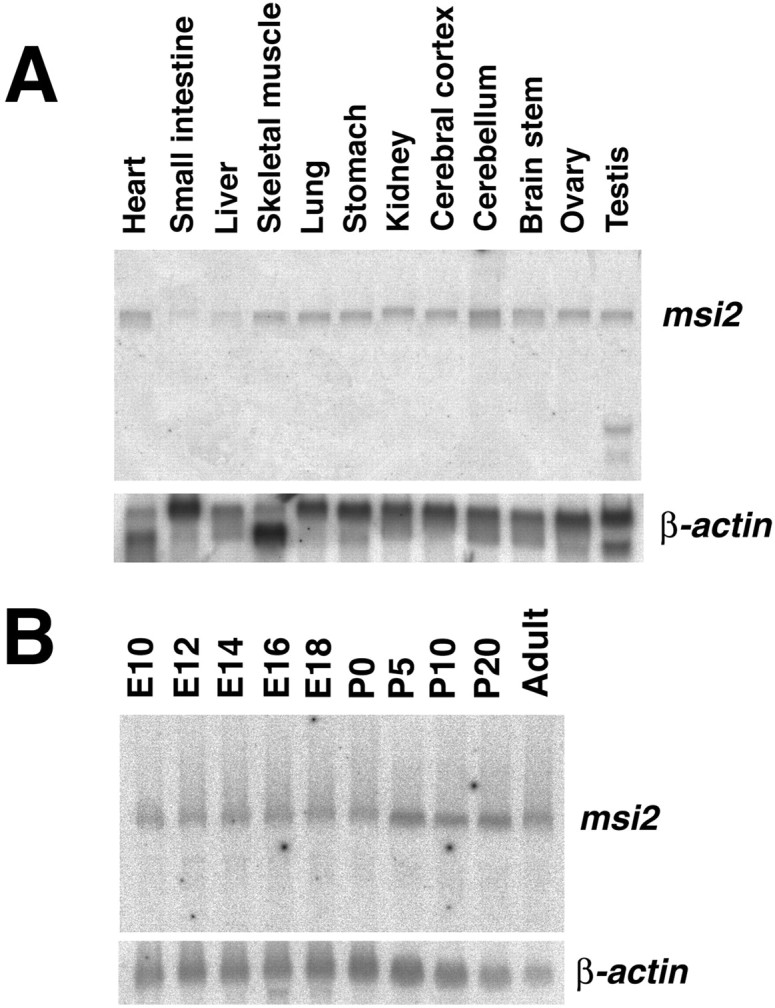
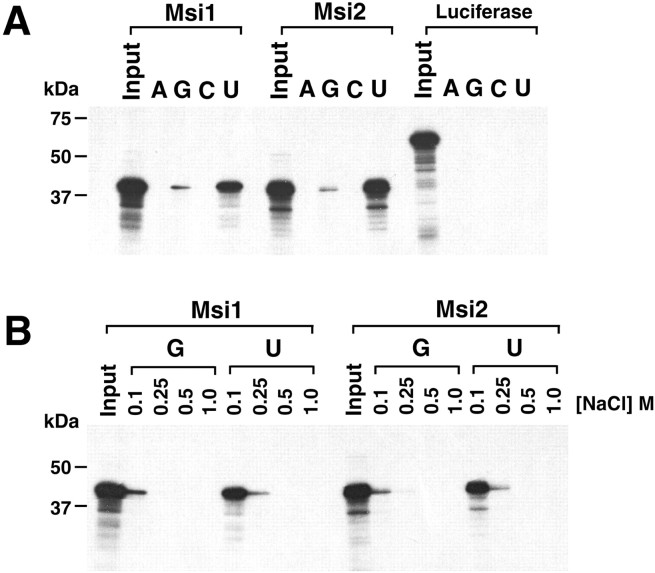
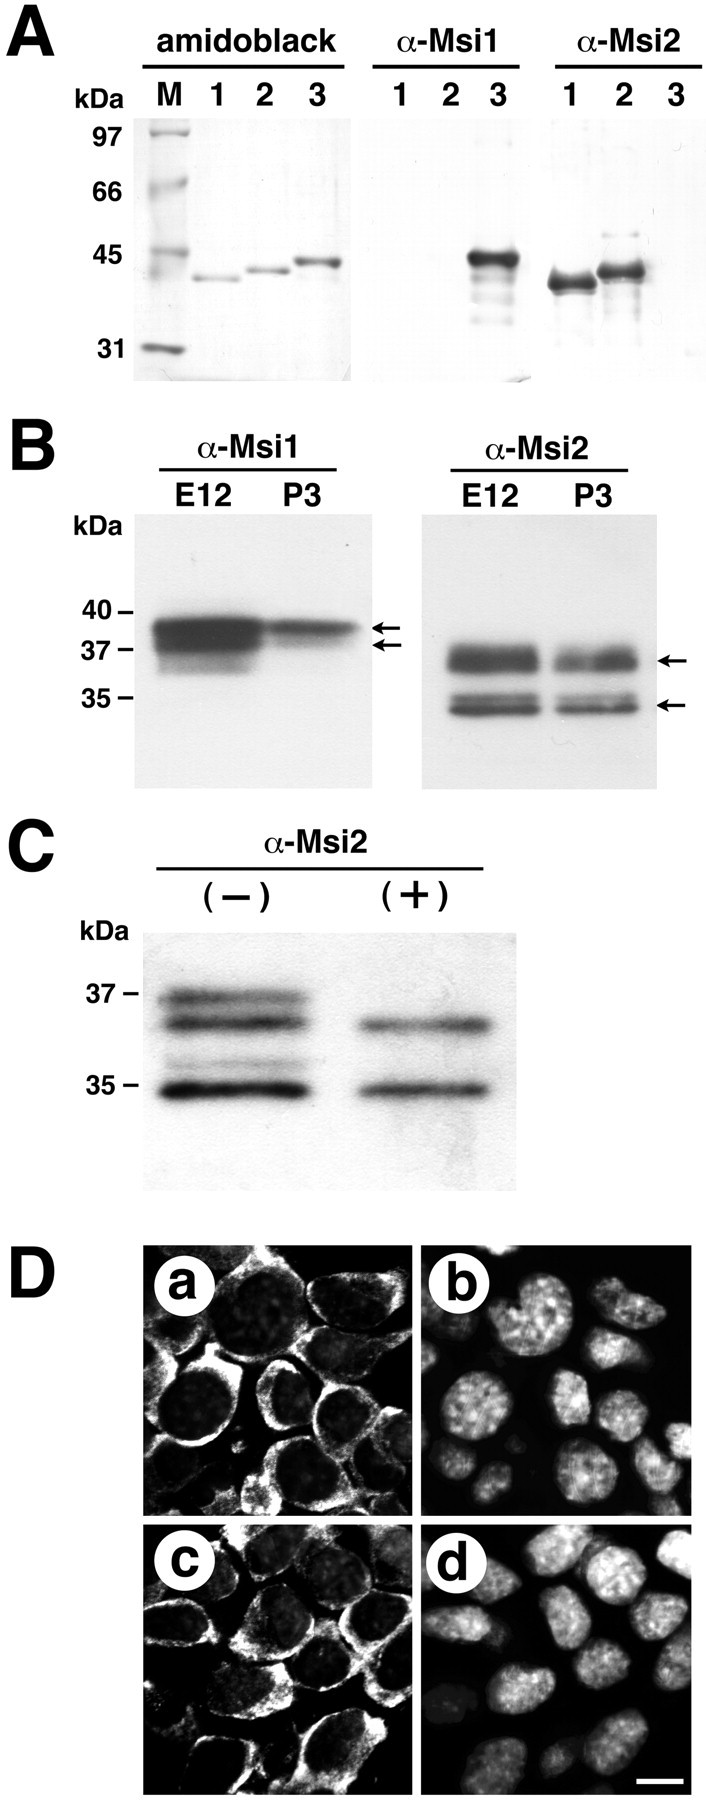
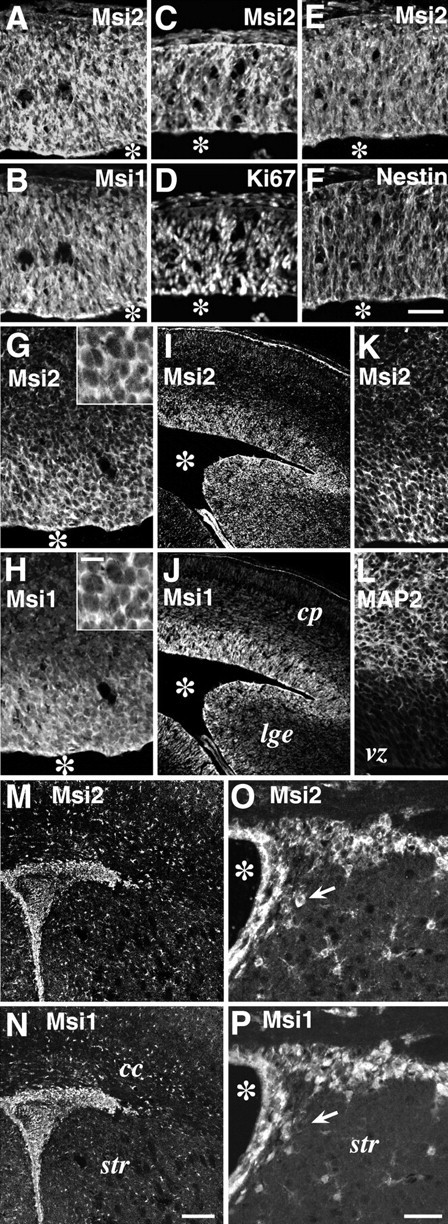
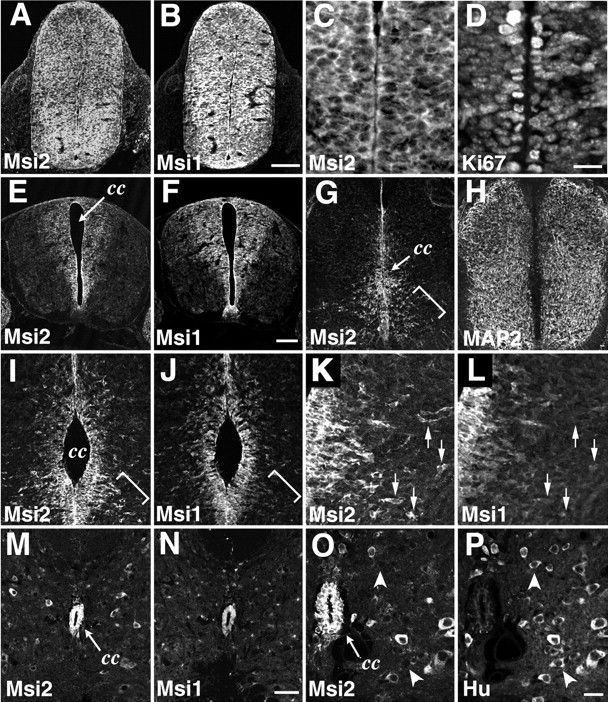
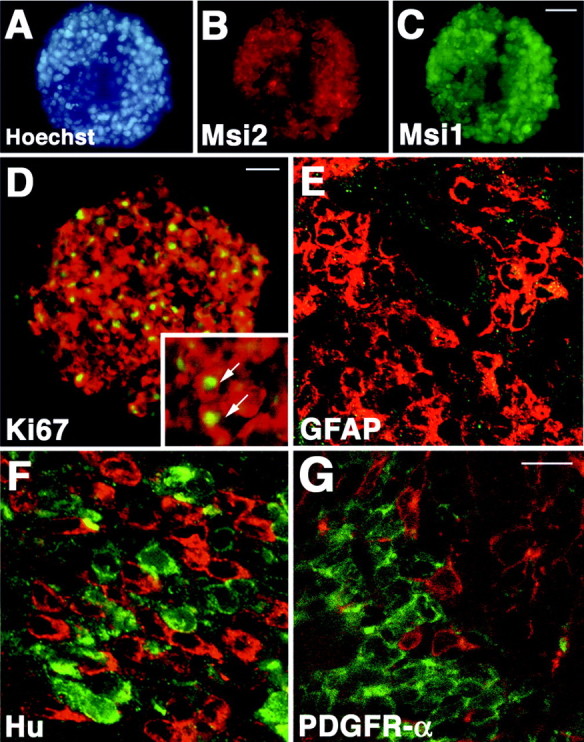
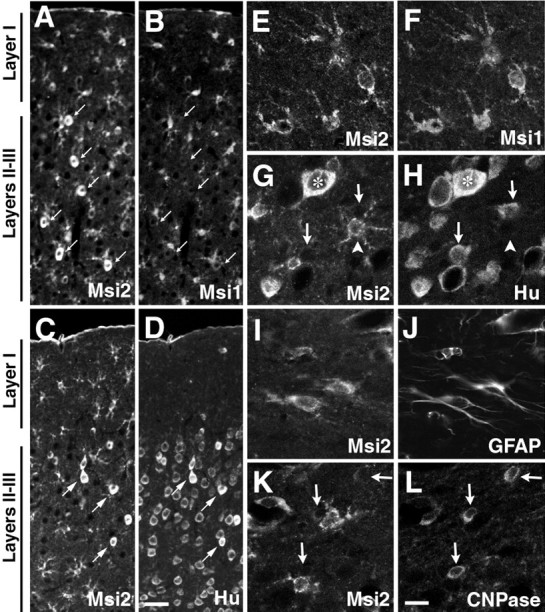
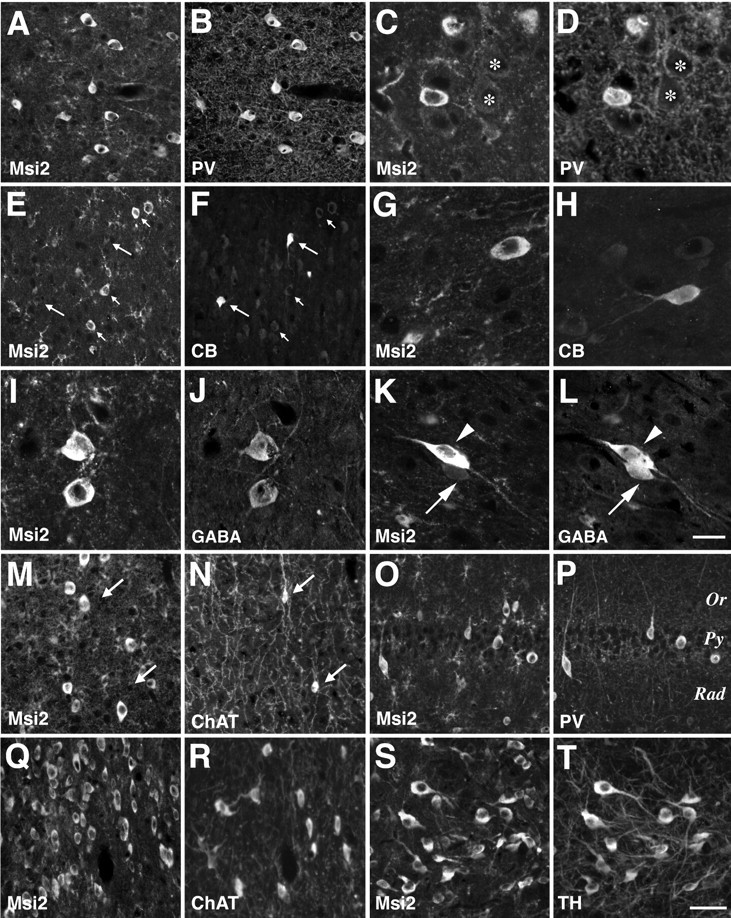
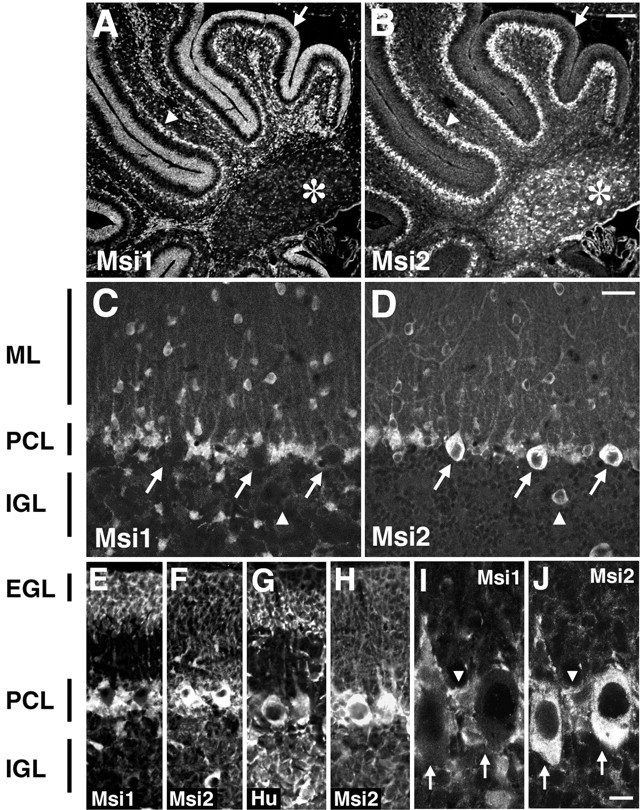
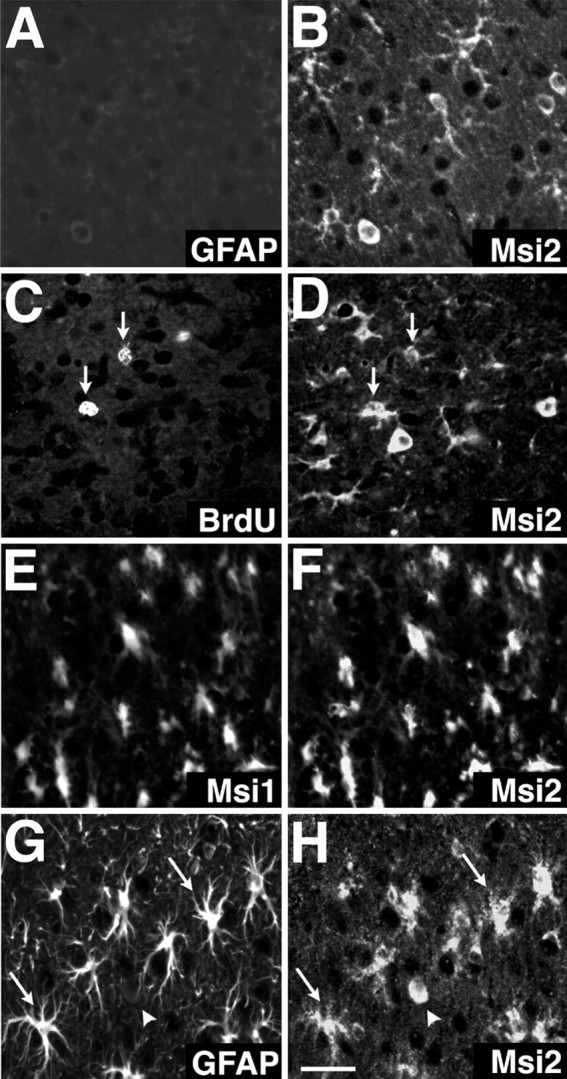
Musashi1 (Msi1) is a mammalian neural RNA-binding protein highly enriched in neural precursor cells that are capable of generating both neurons and glia during embryonic and postnatal CNS development. Here, we identified Musashi2 (Msi2), a novel mammalian RNA-binding protein that exhibits high sequence similarity to Msi1. The Msi2 transcript appeared to be distributed ubiquitously in a wide variety of tissues, consistent with the mRNA distribution of its Xenopus homolog, xrp1. However, the present study revealed cell type-specific and developmentally regulated expression of Msi2 in the mammalian CNS. Interestingly, Msi2 was expressed prominently in precursor cells in the ventricular zone and subventricular zone with the same pattern as Msi1 throughout CNS development. In the postnatal and adult CNS, this concurrent expression of Msi2 and Msi1 was seen in cells of the astrocyte lineage, including ependymal cells, a possible source for postnatal CNS stem cells. During neurogenesis, the expression of both Msi2 and Msi1 was lost in most postmitotic neurons, whereas Msi2 expression persisted in a subset of neuronal lineage cells, such as parvalbumin-containing GABA neurons in the neocortex and neurons in several nuclei of the basal ganglia. Msi2 may have a unique role that is required for the generation and/or maintenance of specific neuronal lineages. Furthermore, in vitro studies showed that Msi2 and Msi1 have similar RNA-binding specificity. These two RNA-binding proteins may exert common functions in neural precursor cells by regulating gene expression at the post-transcriptional level.


Figures

Fig. 1.
Fig. 1.
Primary structure and chromosomal localization of Msi2 and Msi1. A, The deduced amino acid sequence of mouse Msi2 protein. The two RNA recognition motifs areunderlined. Each RRM includes two highly conserved sequences designated RNP-1 and RNP-2(boxed sequences). The broken underlinesindicate the regions that are missing in the form arising from alternative mRNA splicing. Asterisks denote the peptide sequence used as an immunogen to generate anti-Msi2 antibody.B, Domain structures of the mouse Msi2 and Msi1 proteins. The percentages of amino acid identity between Msi1 and Msi2 within each RRM and in the C-terminal half are shown. Bulged small boxes represent the regions arising from alternative splicing. C, Amino acid sequence alignment of mouse Msi2 with its known homologs, Xenopus RNA-binding protein (XRP1), and mouse Msi1. The two RRMs are boxed, and gaps in the alignment are indicated by dashes. Amino acid residues conserved in more than two proteins are shaded.D, Dendrogram showing a multiple sequence comparison of various mammalian RRM-containing RNA-binding proteins. Sequences derived from selected proteins were compared using the clustalW program on the DDBJ www server. The branch lengths are proportional to the differences between sequences. The accession numbers of each protein are given in Materials and Methods. E, Chromosomal localization of the mouse msi1 and msi2genes by FISH. The left panels show metaphase chromosomes stained with DAPI for the identification of individual mouse chromosomes. Chromosomes 11 and 5are numbered. The right panels represent the same metaphase chromosomes with the hybridization signals from themsi2 (top panels) and msi1(bottom panels) genes (arrows indicate each signal). The closed bars on the right side of each ideogram indicate the possible location of the msi2 andmsi1 genes.
Fig. 2.
Fig. 2.
Tissue distribution and developmental expression of the msi2 transcripts. Total RNA (20 μg) from each mouse tissue was prepared, and the levels of msi2 mRNA were determined by Northern blot analysis. A, Tissue distribution of msi2 mRNA in adults. Expression of a 7.0 kb transcript can be seen in most lanes. A short transcript of ∼1.5 kb is observed only in the testis. B, Changes inmsi2 mRNA expression in the whole brain associated with development. Msi2 mRNA expression can be seen at E10, the earliest time point tested. The equal loading and quality of the RNAs were tested by performing the hybridization with a β-actin probe, shown in each bottom panel.
Fig. 3.
Fig. 3.
Similar RNA-binding properties of Msi2 and Msi1 proteins. A, Binding of the full-length Msi2 and Msi1 proteins to ribonucleotide homopolymers.35S-methionine-labeled, in vitro-translated Msi2, Msi1, and Luciferase (as a control protein) were incubated with the indicated ribonucleotide homopolymer beads in buffer containing 100 mm NaCl. Bound proteins were visualized by SDS-PAGE and fluorography as described in Materials and Methods. Ribonucleotide homopolymers and proteins used in the assays are indicated at the top of each lane. Lanes marked Input contain each 35S-labeled protein used for binding reactions. The molecular sizes of markers are indicated on the left. Both Msi2 and Msi1 bound strongly to poly(U) and weakly to poly(G). Luciferase showed no binding to RNA homopolymers. B, Binding profile of Msi2 and Msi1 to RNA homopolymers under stringent conditions. Binding experiments ofin vitro-translated Msi2 and Msi1 with poly(U) and poly(G) beads were performed as described above at the indicated NaCl concentrations. In the buffer containing 0.25 m NaCl, Msi2 and Msi1 binding to poly(G) RNA was greatly diminished, whereas that to poly(U) remained significant. Note that the binding properties of Msi2 to poly(U) and poly(G) in the given salt concentrations were almost identical to those of Msi1.
Fig. 4.
Fig. 4.
Western blot analysis and cytoplasmic localization of Msi1 and Msi2 proteins. A, Specificity of the anti-Msi2 and anti-Msi1 antibodies. Bacterially expressed full-length Msi2S (lane 1), Msi2L (lane2), and Msi1 (lane 3) proteins were subjected to immunoblotting. Membranes were probed with either affinity-purified rabbit polyclonal anti-Msi2 or rat monoclonal anti-Msi1 (14H1) antibodies. The anti-Msi2 antibody specifically detected Msi2L and Msi2S and did not cross-react with Msi1 protein. Conversely, the anti-Msi1 antibody recognized only the Msi1 protein. The left panel shows the blot stained with Amido black dye, confirming the integrity and equal loading of each fusion protein. Lane M indicates protein size markers. B, Changes in Msi2 and Msi1 protein expression during brain development. A Western blot of protein extracts from E12 and P3 brains (30 μg protein per lane) was probed with anti-Msi1 or anti-Msi2 antibodies. The anti-Msi1 antibody recognized a doublet at 37–40 kDa (arrows). Msi2 was detected as two major proteins of 35 and 37 kDa (arrows), and each protein consisted of a closely spaced doublet. C, Msi2 is a phosphoprotein. Western blot analysis for Msi2 in the polysome fraction from E12.5 brain was treated with (+) or without (−) protein phosphatase. Incubation with protein phosphatase produced a downward shift of the slower migrating form in each doublet. D, Confocal images of the neural cell line NG108 stained with anti-Msi1 (a) or anti-Msi2 (c), showing their cytoplasmic localization. b, d, The same fields, counterstained with Hoechst33342 dye to identify the individual nuclei, are shown. Scale bar (shown in d), 8 μm.
Fig. 5.
Fig. 5.
Msi2 expression in neural precursor cells residing in the embryonic VZ and postnatal SVZ. Double-immunofluorescence labeling of coronal sections through embryonic, postnatal, and adult brains, with antibodies against Msi2 and Msi1, Ki67, Nestin, or MAP2.A/B, C/D,E/F, G/H,I/J, K/L,M/N, andO/P represent each pair of double-stained photomicrographs. The primary antibodies used are indicated in each panel. AF, Telencephalon at E10. Msi2 and Msi1 are uniformly distributed in the Ki67- and Nestin-positive neuroepithelium. G/H, Cerebral cortex at E12.Insets indicate higher magnifications of the VZ cells.IL, Cerebral cortex at E14. Coincidental expression of Msi2 and Msi1 is seen in the VZ of the telencephalon and ganglionic eminences. Note the absence of Msi2 expression in the intermediate zone and cortical plate, which are occupied by MAP2-positive immature neurons.M/N, The SVZ region surrounding the lateral ventricle in P7 postnatal forebrain. O/P, Adult ependyma and SVZ lining the lateral ventricle. Lateral is to the right, and dorsal is up. Many densely packed cells that are brightly immunostained with both Msi2 and Msi1 are observed in the P7 SVZ, adult SVZ, and ependymal layer. Small scattered astrocytes in the parenchyma are also labeled with anti-Msi2 and anti-Msi1 antibodies. The arrow in O/P indicates a Msi2-positive but Msi1-negative neuron-like cell. Scale bars:AH, K, L, 50 μm; I, J, M,N, 90 μm; O, P, 25 μm;insets in G and H, 8 μm.Asterisks indicate lateral ventricle. cp, Cortical plate; vz, ventricular zone;lge, lateral ganglionic eminence; cc, corpus callosum; str, striatum.
Fig. 6.
Fig. 6.
Msi2 expression in the spinal cord. Double-immunofluorescence labeling of horizontal sections through the embryonic and adult lumbar spinal cord, with antibodies against Msi2 and Msi1, MAP2, or Hu. A/B,C/D, E/F,G/H, I/J,K/L, M/N, andO/P represent each pair of double-stained photomicrographs. The primary antibodies used are indicated in each panel. A/B, E10 spinal cord. Msi2 and Msi1 are uniformly distributed within the neural tube. C/D, Higher magnification of the ventricular zone of E10 spinal cord, showing the Msi2 expression in the Ki67-positive proliferating neuroepithelial cells. E/F, E12 spinal cord.GL, E14 spinal cord.K/L, Higher magnification of the bracketed area inI/J. Msi2 and Msi1 are simultaneously expressed in the embryonic VZ lining the central canal. Outside the VZ, most of the MAP2-positive postmitotic neurons do not show immunoreactivity for Msi2, whereas a subset of migrating neurons that are sparsely distributed in the ventrolateral area of the mantle layer coexpress Msi2 and MAP2 (bracketed area in G). These Msi2-positive cells are negative for Msi1 and have a few processes, indicating that they are migrating out of the VZ (bracketed portion in I/J, andarrows in K/L). M/N, Adult spinal cord. O/P, Higher magnification ofM/N. In the adult spinal cord, Msi2 and Msi1 are highly expressed in ependymal cells surrounding the central canal. Note the Msi2 expression in some, but not all, populations of neurons scattered within the parenchyma. Arrowheads in Oand P indicate Hu-positive but Msi2-negative neurons.cc, Central canal. Scale bars: A,B, 100 μm; C, D, 12 μm;EH, 50 μm; I, J, M, N, 45 μm; K, L, O, P, 10 μm.
Fig. 7.
Fig. 7.
Msi2 expression in neurospheres and absence of Msi2 in the immature neurons or oligodendrocyte precursor cells lying in the SVZ. AC, Double immunostaining of neurosphere from E14.5 embryonic telencephalon, showing the coexpression of Msi2 (B, red) and Msi1 (C, green). Nuclei are counterstained with Hoechst dye (A, blue). D, Msi2 expression (red) in Ki67-positive proliferating cells (green) in a neurosphere. Inset shows the higher view of the neurosphere. Arrows point to the Msi2 and Ki67 double-positive cells. Note that Msi2 is mainly localized in the cytoplasm of the cells in neurosphere, whereas the antibody to Ki67 only stains the nuclei. EG, Scanning confocal images of the coronal sections through the SVZ surrounding the lateral ventricle of the P2 mouse forebrain. E, GFAP (green) and Msi2 (red). Msi2 is expressed in the GFAP-negative densely packed SVZ cells.F, Hu (red) and Msi2 (green). Hu-positive immature neurons and Msi2-positive cells distribute intermingled within the dorsolateral area of the SVZ, but these two populations of cells hardly overlap with each other. G, PDGFR-α (red) and Msi2 (green). Msi2 expression is never found in oligodendrocyte precursor cells that are positive for PDGFR-α and lie scattered in the SVZ. Scale bars: C, 50 μm;D, 20 μm; E–G, 10 μm.
Fig. 8.
Fig. 8.
Distribution and cell type of Msi2-positive cells in adult cerebrum. Double immunofluorescence labeling of the somatosensory area of the adult neocortex, with antibodies against Msi2 and Msi1, or cell type-specific markers.A/B, C/D,E/F, G/H,I/J, andK/L represent each pair of double-stained photomicrographs. Primary antibodies used are indicated in each panel.AD showing the expression of Msi2 in astrocytes scattered throughout the gray (layers II–III) and white matter (layer I) of the neocortex. Many small Msi2- and Msi1-positive astrocytes with small cell bodies are seen throughout the cortex (A, B). There is also a subset of neurons labeled with Msi2 (A/B, arrows) with larger cell bodies, which are found sparsely in layers II–III, and coexpress Hu antigens (C/D, arrows) but are never labeled with Msi1 (compareA/B with C/D). The pial surface is at thetop. EL, High-power photomicrographs of Msi2-expressing cells in the gray matter (layers II–III, E-H) and white matter (molecular layer,I/J; subcortical white matter,K/L). In the gray matter, concurrent expression of Msi2 and Hu is observed in a few round neuronal cells (asterisks in G/H), whereas numerous other Hu-positive neurons lack immunoreactivity for Msi2 (arrows in G/H). There is also a considerable number of Hu-negative but Msi2-positive cells, which have small oval cell bodies with elaborated multiple short processes (arrowhead in G/H). These cells may represent the population of GFAP-negative protoplasmic astrocytes that are frequently observed in deep gray matter and are positive for Msi1 (E/F). Fibrous astrocytes in the superficial molecular layer and near the pial surface show colocalization of Msi2 and GFAP (I/J), whereas CNPase-positive oligodendroglial cell bodies predominant in the subcortical white matter are Msi2 negative (arrows in K/L). Scale bars: AD, 25 μm;EL, 8 μm.
Fig. 9.
Fig. 9.
Msi2 expression in parvalbumin-positive GABAergic neurons in the adult neocortex. Double-immunofluorescence labeling with antibodies against Msi2 and parvalbumin (PV), calbindin-D28K (CB), GABA, choline acetyltransferase (ChAT), or tyrosine hydroxylase (TH) was performed on coronal sections of adult cerebral cortex, basal ganglia, and hippocampus.A/B, C/D,E/F, G/H,I/J, K/L,M/N, O/P,Q/R, andS/T represent each pair of double-stained photomicrographs. Primary antibodies used are indicated in each panel.A/B, Neocortex layers II–III, showing the coincidental expression of Msi2 and PV in GABAergic nonpyramidal neurons. Faint staining of Msi2 is also seen in the fine-branched processes and small cell bodies of astrocytes. C/D, Higher magnification of the Msi2- and PV-positive neurons in the deeper layer V. The somata of large pyramidal neurons surrounded by parvalbumin-positive multi-terminal endings express neither Msi2 nor PV (asterisks). E/F, Neocortex layers II–III stained with Msi2 and CB. Note that these two populations of neurons are intermingled but do not overlap with each other.Long arrows indicate Msi2-negative CB-positive neurons.Short arrows indicate the neurons that are Msi2 positive but CB negative. G/H, Higher magnification of neurons that express CB or Msi2 in layers II–III. I/J,K/L, Layers II–III stained with antibodies to Msi2 and GABA, showing the Msi2 expression in GABA-containing neurons. (I/J and arrowhead inK/L). Arrow in K/L points to a GABA-containing but Msi2-negative neuron. M/N, Gray matter of the neocortex, showing the absence of Msi2 expression from ChAT-positive cholinergic neurons (arrows).O/P, Hippocampal formation, showing the coexpression of Msi2 and PV in a small number of interneurons in the CA1 subfield. Numerous CA1 pyramidal neurons aligned in rows are not labeled with either Msi2 or PV. Q/R, S/T, Nuclei of the vertical limb of the diagonal band and the zona incerta, respectively. In the basal ganglia, Msi2 immunoreactivity was found in several ChAT-positive cholinergic neurons in the nuclei of diagonal bands (Ch2 and Ch3), in addition to the PV-positive neurons. Msi2 is also expressed in TH-positive dopaminergic neurons (A13) within the zona incerta in the subthalamic region. Scale bars:A, B, E, F,MT, 25 μm; C,D, G, H,IL, 8 μm. Rad, Stratum radiatum; Py, stratum pyramidale; Or, stratum oriens.
Fig. 10.
Fig. 10.
Msi2 expression in the cerebellum. Double-immunofluorescence labeling of sagittal sections through the early postnatal and adult cerebellum, with antibodies against Msi2 and Msi1 or Hu. A/B,C/D, E/F,G/H, andI/J represent each pair of double-stained photomicrographs. Primary antibodies used are indicated in each panel.A/B, P3 cerebellum. Intense Msi1 staining is observed in neuronal precursor cells in the EGL (indicated byarrow), in addition to the cells in the PCL (arrowhead) and numerous glial precursor cells in the folia white matter. Msi2 expression is prominent in the PCL and is faint in EGL cells and glial precursor cells in the white matter. Deep cerebellar nuclei (asterisk) are labeled only with Msi2.EH, P7 cerebellum. The EGL is toward the top part of the panels. At P7, a low level of Msi2 expression is seen in the EGL (E/F). In the PCL, Purkinje cells forming a single row show immunoreactivity for both Msi2 and Hu but not for Msi1, whereas many small cells residing in the vicinity of the Purkinje cells express both Msi2 and Msi1 (compareE/F with G/H). These cells are likely to be the developing Bergmann glia. Msi2 expression is absent from Hu-positive granule neurons in the IGL. C/D, Adult cerebellum. In adults, Msi2 is predominantly expressed in the Purkinje cells (arrows in C/D) and Bergmann glial cells, which have cell bodies located adjacent to the large cell bodies of Purkinje cells and extend their tangential processes into the ML.Arrowhead in C/D represents the Golgi neuron in the IGL. I/J, Higher magnifications of the adult PCL. Arrows in I/J indicate the Purkinje cells, and arrowhead inI/J points to the soma of a Bergmann glial cell. ML, Molecular layer; PCL, Purkinje cell layer; IGL, internal granule layer;EGL, external granule cell layer. Scale bars:A, B, 100 μm; C–H, 30 μm; I, J, 8 μm.
Fig. 11.
Fig. 11.
Induced expression of Msi2 and Msi1 in reactive astrocytes. Double-label fluorescence localization of Msi2 and Msi1, BrdU, or GFAP in the injured region of adult cerebral cortex immediately (day 0) (A, B) or 4 d (C–H) after lesioning. All photomicrographs correspond to cortex layers II–III, and the lesioned sites are toward the top in all panels. A,B, GFAP and Msi2 at day 0. The vicinity of the site of injury shows no immunoreactivity for GFAP. C,D, BrdU and Msi2 at 4 d after lesion. Msi2 is expressed in a population of BrdU-positive proliferating cells (arrows) that lie close to the injury site.E, F, Msi1 and Msi2 at 4 d after lesion. Simultaneous expression of Msi1 and Msi2 is evident in many enlarged reactive cells. G, H, GFAP and Msi2 at 4 d after lesion. Intense immunoreactivity of Msi2 is observed in an increased number of GFAP-positive reactive astrocytes; these cells exhibit enlarged, elongated cell bodies with multiple processes (arrows). Arrowhead indicates a rare Msi2-positive neuron-like cell that has an oval cell body and is immunonegative for GFAP. Scale bar (shown in H):AH, 18 μm.

Similar articles

Cited by

References

    1. Akamatsu W, Okano HJ, Osumi N, Inoue T, Nakamura S, Sakakibara S, Miura M, Matsuo N, Darnell RB, Okano H. Mammalian ELAV-like neuronal RNA-binding proteins HuB and HuC promote neuronal development in both the central and peripheral nervous systems. Proc Natl Acad Sci USA. 1999;96:9885–9890. - PMC - PubMed
    1. Altman J. Postnatal development of the cerebellar cortex in the rat. J Comp Neurol. 1972;145:353–398. - PubMed
    1. Amano T, Hamprecht B, Kemper W. High activity of choline acetyltransferase induced in neuroblastoma × glioma hybrid cells. Exp Cell Res. 1974;85:399–408. - PubMed
    1. Barami K, Iversen K, Furneaux H, Goldman SA. Early expression of Hu proteins by newly generated neurons of the adult avian forebrain. J Neurobiol. 1995;28:82–101. - PubMed
    1. Bayer SA, Altman J. Neocortical development. Raven; New York: 1991.

Publication types

MeSH terms

Associated data