. 2001 Oct 15;21(20):8136-44.
doi: 10.1523/JNEUROSCI.21-20-08136.2001.

Feature selectivity and interneuronal cooperation in the thalamocortical system

Affiliations

Feature selectivity and interneuronal cooperation in the thalamocortical system

L M Miller et al. J Neurosci. .

Abstract

Action potentials are a universal currency for fast information transfer in the nervous system, yet few studies address how some spikes carry more information than others. We focused on the transformation of sensory representations in the lemniscal (high-fidelity) auditory thalamocortical network. While stimulating with a complex sound, we recorded simultaneously from functionally connected cell pairs in the ventral medial geniculate body and primary auditory cortex. Thalamic action potentials that immediately preceded or potentially caused a cortical spike were more selective than the average thalamic spike for spectrotemporal stimulus features. This net improvement of thalamic signaling indicates that for some thalamic cells, spikes are not propagated through cortex independently but interact with other inputs onto the same target cell. We then developed a method to identify the spectrotemporal nature of these interactions and found that they could be cooperative or antagonistic to the average receptive field of the thalamic cell. The degree of cooperativity with the thalamic cell determined the increase in feature selectivity for potentially causal thalamic spikes. We therefore show how some thalamic spikes carry more receptive field information than average and how other inputs cooperate to constrain the information communicated through a cortical cell.


Figures

Fig. 1.
Fig. 1.
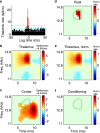
Functionally connected thalamocortical pair.a, The cross-correlogram is normalized to express the thalamic firing rate relative to a cortical spike occurring at time lag 0. The brief, short-latency peak, with thalamic spikes leading cortical (2 msec), is indicative of a monosynaptic-like functional connection. The yellow box denotes the time-locked thalamic spikes that precede a cortical spike by 1–10 msec. The cyan line is the mean, and the green lines are the 99% confidence intervals, under an assumption of independent, Poisson spike trains. b, Thalamic STRF. Thex-axis represents time preceding a spike, and they-axis represents stimulus frequency. STRFcolor indicates a differential change in firing rate from the occurrence of stimulus energy in a particular spectrotemporal location. Warm colors mean that stimulus energy at that location tends to increase firing rate above the mean (4.85 spikes/sec), and cool colors indicate a decrease in firing rate. This cell, for instance, fires maximally 7.5 msec after stimulus energy occurs at 13–14 kHz. c, Cortical STRF. Overlying the cortical STRF, for comparison, is a green contour circumscribing the high-energy peak of the thalamic STRF. If one would shift the green contour by the 2 msec lag seen in the correlogram, these STRFs would overlap very well.
Fig. 2.
Fig. 2.
Potentially causal thalamic spikes are more selective for stimulus features than expected. The differences in FSI for all thalamic cells between time-locked and average spikes are summarized in a histogram. Positive differences indicate that time-locked spikes have a greater FSI than average. Many cells show very little difference; a few have a negative difference, indicating that time-locked spikes are less selective than average; and many show a positive difference, up to fourfold greater. The mean difference of 65% is significantly different from 0 (paired t test,p = 0.013); that is, time-locked thalamic spikes tend to be more selective than average for spectrotemporal stimulus features.
Fig. 3.
Fig. 3.
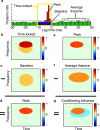
Schematic of methods to identify the stimulus-dependent influence that conditions whether the spikes of a thalamic cell are propagated by the target cortical cell.a, The cross-correlogram can be conceptually divided into subsets of thalamic spikes. Time-locked spikes (yellow box) are those that precede a cortical spike by 1–10 msec. Of the time-locked spikes, the baseline spikes (blue) would have occurred even in the absence of a functional connection. Peak spikes (red) are those that actually caused the cortical cell to fire. The cyan lineis the mean, and the red lines are the 99% confidence intervals, under an assumption of independent, Poisson spike trains. In this figure only, STRFs are simulated for clarity (b–g). The time-locked STRF (b) minus the baseline STRF (c; see Materials and Methods) gives an estimate of the peak, causal STRF (d). The degree to which the peak STRF differs from the average thalamic STRF is the degree to which other influences condition whether the thalamic spikes are propagated by cortex. Therefore, the peak STRF (e) minus the average thalamic STRF (f) gives a spectrotemporal description of the conditioning influence (g). Positive regions in the conditioning influence mean that for the spikes of this thalamic cell to be propagated through cortex, there must be more average energy in that region than typically drives the thalamic cell. Negative regions require that for spikes to be propagated, there must be less average energy in that region than usually drives the thalamic cell.
Fig. 4.
Fig. 4.
Absence of conditioning influence.a, In the thalamocortical correlogram, red bins are the peak thalamic spikes, those that presumably caused a cortical spike. (See Fig. 1 legend for other correlogram details.)b, Thalamic STRF. c, Cortical STRF. To aid interpretation, only the significant (p< 0.002) STRFs are plotted. In deriving the peak and conditioning STRFs, however, all operations were performed on the raw, nonthresholded signals. The STRFs in d–f are plotted with the same color scale for comparison. d, The peak STRF (spike-normalized) estimates the response properties of only the thalamic spikes that caused a cortical spike. e, The thalamic STRF is replotted but here is spike-normalized for direct comparison with the peak STRF. In this case, the peak STRF is similar in location and magnitude to the average thalamic STRF.f, Stimulus-related conditioning influence on whether thalamic spikes are propagated through the cortical cell. For this thalamic neuron, when the average STRF is subtracted from the peak STRF, only noise remains, so that no significant conditioning influence is observed; the presumed causal spikes are not unique in the way they represent stimuli. For visual reference in c,d, and f, a green contourindicates the location of the high-energy peak of the thalamic STRF.Freq., Frequency; Norm., normalized.
Fig. 5.
Fig. 5.
a–f, Cooperative conditioning influence. a, In the thalamocortical correlogram,red bins are the peak thalamic spikes, those that presumably caused a cortical spike. (See Fig. 1 legend for other correlogram details.) b, Thalamic STRF.c, Cortical STRF. To aid interpretation, only the significant (p < 0.002) STRFs are plotted. In deriving the peak and conditioning STRFs, however, all operations were performed on the raw, non-thresholded signals. The STRFs ind–f are plotted with the same color scale for comparison. d, The peak STRF (spike-normalized) estimates the response properties of only the thalamic spikes that caused a cortical spike. e, The thalamic STRF is replotted but here is spike-normalized for direct comparison with the peak STRF. In this case, the peak STRF has considerably greater magnitude than the average thalamic STRF. Its excitatory region, moreover, overlaps only the lower-frequency portion of the average thalamic excitatory subfield. f, Stimulus-related conditioning influence on whether thalamic spikes are propagated through the cortical cell. For this thalamic neuron, the conditioning influence is cooperative. For thalamic spikes to cause a cortical spike, both excitatory and inhibitory regions must be of greater average magnitude and of slightly different frequency content than typically causes the thalamic cell to fire. For visual reference inc, d, and f, agreen contour indicates the location of the high-energy peak of the thalamic STRF. g–l, Antagonistic conditioning influence. g, Thalamocortical correlogram.h, Thalamic STRF. i, Cortical STRF. The STRFs in j–l are plotted with the same color scale for comparison. j, The peak STRF (spike-normalized) estimates the response properties of only the thalamic spikes that caused a cortical spike. k, The thalamic STRF is replotted but here is spike-normalized for direct comparison with the peak STRF. In this case, the peak STRF is similar in magnitude but more limited in spectrotemporal extent than the average thalamic STRF.l, Stimulus-related conditioning influence on whether thalamic spikes are propagated through the cortical cell. For this thalamic neuron, the conditioning influence is antagonistic. For thalamic spikes to cause a cortical spike, the stimulus must contain less energy, on average, in regions that typically excite the thalamic cell. For visual reference in i, j, andl, a green contour indicates the location of the high-energy peak of the thalamic STRF. Freq., Frequency; Norm., normalized.
Fig. 6.
Fig. 6.
Relationship between the cooperativity of conditioning influence and the difference in feature selectivity for potentially causal spikes. The similarity index for the conditioning influence and the average thalamic STRF indicates the degree of cooperation (positive values) or antagonism (negative values). The FSI difference between time-locked, potentially causal spikes and average spikes quantifies how much more or less stimulus information the time-locked spikes carry. Similarity index and FSI differences are significantly and positively correlated (r = 0.50; 0.01 <p < 0.02). The dashed line is the best fit in a least mean squares sense. Asterisks are pairs from Figures 4 and 5. Cooperative conditioning influences tend to increase the feature selectivity of time-locked spikes, and antagonistic conditioning tends to decrease it.

Similar articles

Cited by

References

    1. Aertsen AMHJ, Johannesma PIM. Spectro-temporal receptive fields of auditory neurons in the grassfrog. Biol Cybern. 1980;38:223–234. - PubMed
    1. Alonso JM, Usrey WM, Reid RC. Precisely correlated firing in cells of the lateral geniculate nucleus. Nature. 1996;383:815–819. - PubMed
    1. Cotillon N, Nafati M, Edeline JM. Characteristics of reliable tone-evoked oscillations in the rat thalamo-cortical auditory system. Hear Res. 2000;142:113–130. - PubMed
    1. Creutzfeldt O, Hellweg FC, Schreiner CE. Thalamocortical transformation of responses to complex auditory stimuli. Exp Brain Res. 1980;39:87–104. - PubMed
    1. Dan Y, Alonso JM, Usrey WM, Reid RC. Coding of visual information by precisely correlated spikes in the lateral geniculate nucleus. Nat Neurosci. 1998;1:501–507. - PubMed

Publication types