Comparative Study
. 2001 Oct 15;21(20):8286-301.
doi: 10.1523/JNEUROSCI.21-20-08286.2001.

Functional retinotopy of monkey visual cortex

Affiliations
Comparative Study

Functional retinotopy of monkey visual cortex

G Blasdel et al. J Neurosci. .

Abstract

The operations of primary visual cortex generate continuous representations of orientation, ocular dominance, and retinotopy that, to fit in two dimensions, organize at separate but overlapping scales (e.g., 20-500 microm, 200 microm to 5 mm, and 2-33 mm). Where their scales overlap, these organizations interact; iso-orientation contours cross ocular dominance columns at right angles, and ocular dominance columns distort retinotopy near the V1/V2 border. To explore these interactions, we developed an optical technique for visualizing retinotopy in vivo that allows us to analyze it in relation to ocular dominance and orientation patterns. Our results show local retinotopic distortions in every region of macaque V1 that we examine, including regions far from the V1/V2 border. They also show a consistent relation between local axes of distortion and ocular dominance slabs, which they intersect at angles of approximately 90 degrees. A further correlation is provided by retinotopic maps from New World primates that show less distortion (9 vs 60%) in two species characterized by an absence of pronounced ocular dominance columns. Retinotopic maps from these New World primates also revealed an unexpected tilt of the vertical midline representation that diverged from the V1/V2 border by an angle of approximately 20 degrees. Overall, these results suggest a general tendency for slab-based organizations to distort retinotopy by representing the same part of space more than once in adjacent slabs.


Figures

Fig. 1.
Fig. 1.
Representation of the contralateral visual hemifield in area V1 of the macaque monkey. The primary visual cortex (also known as striate cortex, area 17, and V1) lies at the back of the head, where it occupies ∼1200 mm2, an area half the size of a credit card. It is divided between two hemispheres, with each side representing the contralateral half of visual space. Approximately half the cortex on each side forms a large flat area on the operculum, under the cranium, which represents the central 8° of the contralateral visual field. This diagram shows representations of vertical, horizontal, and oblique meridia on this surface to an eccentricity of ∼8°. The vertical meridian, indicated by theblack half-arrows, runs along the outer boundary of V1. Because of an exponential change in magnification with eccentricity, it bulges out, encircling most of V1, and causing representations of many straight lines to appear curved and curved lines to appear straight (Bressloff et al., 2001). It is important to note that the surface representation of space is inverted around the horizontal axis. Hence, left–right relations are preserved while upper and lower parts of visual space are represented in the lower (posterior) and upper (anterior) parts of V1.
Fig. 2.
Fig. 2.
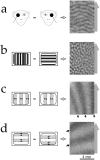
Differential imaging of ocular dominance, orientation, and retinotopy in monkey visual cortex. All these techniques rely on small changes in reflectance with activity, which were first observed by Penfield (1933), and used by Blasdel and Salama (1986) to visualize patterns of ocular dominance and orientation preference in vivo. Subsequent techniques have used the same or similar signals to produce similar patterns (Ts'o et al., 1990; Bonhoeffer and Grinvald, 1993). Here, we compare cortical images obtained during comparable states of activity, while one stimulus variable was modulated with the others held constant. Because all reflectance changes associated with unmodulated variables are the same, they are removed by subtraction, whereas changes associated with the modulated variable are reinforced. These principles are illustrated by four examples in a–d. To facilitate visual field comparisons, each of the resulting images has been rotated and inverted to bring retinotopic coordinates into alignment with visual space. To keep track of these changes, we have added a gray half-arrow to the right of each frame to indicate the side and the axis of the V1/V2 border (which represents the vertical midline) directed toward the fovea, in the direction of increasing magnification. a, Ocular dominance pattern. In this example, an image of ocular dominance bands was obtained by modulating the eye receiving input. One eye was covered on alternate trials. Images of cortex responding to the right eye (left eye covered) were added to the final image while images of cortex responding to the left eye were subtracted. Hence, regions responding better to the right and left eyes appear dark and light, producing a pattern of bands that projects perpendicularly into the V1/V2 border. As noted above, all the stimuli were similar in regard to basic structure and speed of movement. b, Pattern of orientation selectivity. The same stimulus was seen by both eyes while the orientation of edges was modulated. Images of the cortex responding to horizontal contours were subtracted from images of it responding to vertical contours. Hence, dark and light regionsindicate preferences for vertical and horizontal. Note how different this pattern looks from that in a, even though both were obtained from the same region of cortex within a few hours.c, Retinotopic representation of vertical apertures. These patterns were obtained by modulating the position of vertically oriented stimuli seen by one eye. With the left eye covered, the same stimuli used to induce patterns in a andb were presented through complimentary, slit-shaped apertures on alternate trials. Hence, the regions of space containing stimuli during one trial remained blank during the other. The regions of cortex representing one set of apertures and its complement thus appear dark and light. Because the apertures used were oriented vertically, the bands run parallel to the V1/V2 border. d, Retinotopic representation of horizontal apertures. The paradigm used to induce this pattern was similar to that in c. However, in this case the apertures were oriented horizontally. Hence, the induced bands run perpendicular to the bands in c as well as to the V1/V2 border. Note the wider interval for bands in this image, although the apertures used to induce them repeated at the same interval as those inc.
Fig. 3.
Fig. 3.
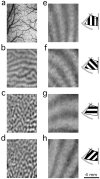
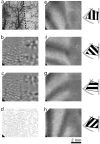
Differential images of ocular dominance, orientation, and four axes of retinotopic meridia, from a single region of macaque striate cortex. With the exception of a, which shows the vasculature, each frame shows a differential image from the same region of macaque striate cortex that we acquired with the same equipment and stimuli and within a relatively short period of time. Because we used the same stimuli on each occasion, the difference between successive patterns was the variable that was modulated.a, Image of the overlying vasculature, as it appeared under green (540 nm) light. Because light passes through each blood vessel twice (on its way in and then again on its way back out), even minor perfusion changes can lead to spurious changes in the final pattern if they are large enough, or if they correlate, even partially, with the modulated variable (Blasdel, 1992). They are included here for reference so that important conclusions can be restricted to regions where vascular artifacts are least likely (Obermayer and Blasdel, 1993). Because the 720 nm light we use is minimally absorbed by hemoglobin (McLoughlin and Blasdel, 1998), there are few signs of artifact in most of the imaged patterns (b–h).b, Differential image of ocular dominance, obtained by subtracting images of cortex responding to the left eye from images of it responding to the right eye. The light anddark bands correspond to regions dominated by the left and right eyes, respectively. They run horizontally at intervals of ∼500 μm (for each right plus left eye pair) and intersect the V1/V2 border at angles of ∼90° (LeVay et al., 1975). c,Differential image of orientation selectivity for vertical and horizontal stimuli. This image was obtained by comparing responses with different orientations, rather than different eyes, and thus differs from that in b. Because we compare responses to vertical and horizontal stimuli, dark and light regions indicate selectivities for vertical and horizontal. d,Differential image of orientation selectivity for left and right oblique stimuli. In this image obtained by subtracting right oblique responses from left oblique ones, the dark andlight regions indicate selectivities for left and right oblique. Although the resulting pattern resembles the preceding one inc, it differs by one quarter of a cycle because of the quarter cycle (180/4 = 45°) shift in the orientations compared. Hence, the dark and light peaks in this image line up with the zero-crossings, regions showing no preference for vertical or horizontal, in c. Collectively, this image and that in c reflect the orientation preferences and selectivities for the entire region. e,Differentially imaged responses to vertical 0.7° apertures repeating at 1.4° intervals. In this experiment, we restricted the location of stimuli to narrow strips of space, which alternated with other, complimentary strips on alternate trials. In this example, the apertures are oriented vertically. Hence, the dark andlight bands, which represent each set of apertures, run parallel to the representation of the vertical meridian, itself parallel to the V1/V2 border. f, Differential image of bands induced by 0.7° apertures, repeating at 1.4° intervals, oriented at 45° (left oblique). g, Differential image of bands induced by 0.7° apertures, repeating at 1.4° intervals, oriented at 90° (horizontal). In this experiment, the bands run at right angles to those in e and the V1/V2 border, although both were obtained from the same region of cortex within an hour of time. Also, note the wider intervals between these bands, as opposed to those in e, on account of a greater cortical magnification in the vertical direction (by ∼60%). h,Differential image of bands induced by 0.7° apertures, repeating at 1.4° intervals, oriented at 135° (right oblique).
Fig. 4.
Fig. 4.
Differential images of ocular dominance, orientation, and four axes of retinotopic meridia, from a single part of striate cortex in another macaque monkey. These images (a–h) are similar to those in Figure 3, except that they were obtained in a different animal and from a region of cortex that was located slightly posterior (with respect to the V1/V2 border) to that in Figure 3. Note the dramatically curved bandsin f and g, both of which represent straight apertures in visual space.
Fig. 5.
Fig. 5.
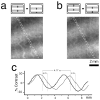
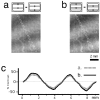
Sensitivity of retinotopic maps to aperture displacement. Whereas differential images of ocular dominance and orientation appear relatively insensitive to the exact location of stimuli used to make them, differential images of position are excruciatingly sensitive, as illustrated in this figure by the relative positions of patterns induced by the same apertures immediately before (a) and after (b) a small (0.25°) shift in gaze elevation. Because the apertures appeared at 1.4° intervals, this corresponded to 17.9% of their period, or a 64° shift in phase. As one can see, this produced a corresponding shift in phase that is most apparent from their profiles (obtained by graphing the average intensity along the same 0.5-mm-wide strip, indicated by broken white lines), which appear superimposed in c. For each profile, the zero-crossings (indicated by vertical dashed lines) are drawn midway between positive and negative peaks on each side. As one can see, the 0.25° shift produced 0.73 and 0.75 lateral displacements in the positions of zero crossings, which, considering the band period of 4.17 mm, correspond to 17.5 and 18%.
Fig. 6.
Fig. 6.
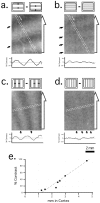
Relation between the contrast and separation of adjacent bands in V1. a–d, These four images were obtained from the same region of primary visual cortex with apertures presented at each of two orientations (top andbottom rows) and two intervals (left andright). The orientation and spacing of the induced band patterns follow these apertures closely. There is a relation between interval and contrast that reflects varying degrees of overlap between the populations activated by complementary apertures. For aperture intervals that are small enough to allow stimuli revealed by complementary apertures to activate the same receptive fields, the differences responsible for generating light anddarkbands rapidly become negligible. As a consequence, smaller aperture intervals generate bands with less contrast. This raises the question of whether the observed reduction in contrast arises directly from the proximity of successively presented apertures in the visual field or from the proximity of cortical regions that become active in response. One can dissect these issues by exploiting the local magnification anisotropy (see below) in cortex to induce different band periods, along different axes in cortex, with the same aperture interval. For example, the bands in b andd were both induced by aperture intervals of 0.7°, yet the bands in d lie closer than the bands inb, and they also appear fainter, to the point at which they barely can be seen. Accordingly, the observed effect on contrast seems to develop from the proximity of cortical activity rather than the proximity of stimulation in the visual field. A similar difference characterizes the patterns in a andc. Although the bands in both patterns were induced by 1.4° intervals, those in c lie closer than those ina, and, the contrast between adjacentlight and dark bands in cappears to be less as a consequence. a, Horizontal apertures, repeating at 1.4° intervals, induce horizontal bands that intersect the V1/V2 border at right angles. b,Horizontal apertures at 0.7° interval also induce horizontal bands that intersect the V1/V2 border at right angles. However, in this case, halving the aperture interval has doubled the number of bands (indicated by arrows). Note how this has also impaired the contrast between adjacent light and dark bands by >50%. c, Vertical apertures at 1.4° intervals induce vertical bands that run parallel to the V1/V2 border.d, Vertical apertures at 0.7° intervals induce twice as many vertical bands at vertical trajectories (seearrows), but the contrast has been reduced so much (more than that in c) that they barely can be seen.e, Relationship between contrast and distance. Each value represents contrast, as a function of distance, between the centers of adjacent dark and light bands. These values were obtained from six differential images of the same region of cortex (which included those in a–d) by measuring the difference between the average pixel intensities of two 100-μm-diameter disks, located at the centers of adjacentdark and light bands, dividing by their average, and plotting their measured contrast (as a fraction of the largest value) as a function of the distance between them. Although these measurements could be made more rigorously, they illustrate a trend that is qualitatively obvious from the images ina–d, that interband contrast decreases linearly with distance to the indicated zero-intercept at 1.2 mm, where it disappears. Over distances smaller than this, there is not even a suggestion of retinotopy, as one can verify qualitatively from the vanishingly faint contrast of bands in d.
Fig. 7.
Fig. 7.
Minimal influence of aperture width on contrast. The images in a and b were both induced by horizontal apertures, repeating at 1.4° intervals, but those ina were induced by apertures that were only half as wide yet in phase. The intensity profile of each pattern (measured along thewhite lines) is represented in c.
Fig. 8.
Fig. 8.
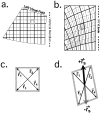
Grid-line representation of the retinotopic patterns induced by vertical (0°; bottom panels) and horizontal (90°; top panels) orientations of repetitive apertures. The pronounced sensitivity of these patterns to lateral displacements (Fig.5) allows each light/dark cycle to be divided into four phases, represented here by grid lines, which correspond to the centers of adjacent dark and light bands, and the zero-crossings in between. These lines were extracted from a single band pattern, through the following procedure:a, we start with the best, artifact-free images of bands representing vertical (bottom panel) and horizontal (top panel) meridia. b,Band-pass filtering (top and bottom panels) removes the high and low frequencies, the periods of which are larger or smaller than the largest and smallest bands in each image. c, Contour plots are obtained by reducing the number of gray levels to 16–32 discrete levels and finding edges. Band centers were then isolated from peak values, in the centers of dark and light bands, whereas contours corresponding to zero-crossings were used to delineate the borders. This allows each band cycle to be divided into four, evenly spaced phases, represented by lines, that correspond to the centers of dark and light bands(representing the centers of each set of apertures), and the zero-crossings between them (representing the edges of apertures in visual space). d, Superposition of extracted contour lines on the image from c. Those in the top frame represent lines of iso-azimuth, whereas those in the bottom frame represent lines of iso-elevation. In subsequent figures, both sets (iso-azimuth and iso-elevation) of lines are combined to form a grid.
Fig. 9.
Fig. 9.
Bands representing oblique apertures run parallel to vertices defined by vertical and horizontal grids. Images in thetop row illustrate iso-azimuth (a) and iso-elevation (b) meridia at regular intervals of 1.4° that are combined in c andd to form square grids. White lines inc and d illustrate how the vertices of these grids connect along left and right oblique trajectories (top row). The second and third rows illustrate results from two animals. In each row, thefirst two examples show iso-azimuth (a) and iso-elevation (b) contours superimposed over the patterns used to extract them. Thethird and fourth panels show combined grids superimposed over band patterns that actually were induced by −45° (c) and +45° (d) apertures. Clearly, the induced bands follow the axes indicated by grid vertices closely. To facilitate comparison, we have connected selected vertices along one of two oblique trajectories with thin white lines. The closeness with which they match emphasizes the internal consistency of these techniques.
Fig. 10.
Fig. 10.
Local measurements of cortical magnification size and symmetry. Because our derived grid (as in Fig. 9c,d) represents a grid of equally spaced iso-azimuth and iso-elevation meridia (a), each quadrangle in brepresents a 0.35 × 0.35° square in space. Accordingly, magnification can be quantified for each quadrangle in relation to each square. Although this can be done in several ways, we use a simple approach that entails the calculation of a baseline scalar and the circular variance of vectors used to define each quadrangle. The details are illustrated in a–d. As a result, one can calculate magnification and circular variance at each location and represent them with vectors that indicate the direction and degree of distortion. These, in turn, can be compared with ocular dominance patterns directly (Fig. 11). a, Visual field projection of the imaged cortex. The unusual shape of its boundary reflects a reversal of the retinocortical distortion applied to the 6.75 × 9 mm2 rectangle of cortex that we imaged. Note that the numbers of thick and thin lines ina and b are conserved. b,This diagram shows the grid we derived from vertical and horizontal band patterns, as explained previously (Fig. 9). From the area and axis of deformation of each quadrangle, it is possible to calculate values for magnification and circular variance at each location. These are indicated by small lines within each quadrangle. The angle and length of each line indicate the axis and degree of deformation. A length of zero indicates no distortion (e.g., a square), whereas a line that touches the edges of the quadrangle indicates infinite distortion in the indicated direction. c,Representation of each quadrangle with four normalized vectors. Because the indicated quadrangle in this example is square, in this instance, the circular variance (obtained by squaring each vector and taking the square root of their sum) is zero. d, In quadrangles that are not square, however, the resulting vector captures the direction and magnitude of deformation.
Fig. 11.
Fig. 11.
Interaction between ocular dominance columns and local magnification. a, This image shows the field of vectors, calculated from the circular variance of quadrangles in Figure10, superimposed on a differential image of ocular dominance from the same region. The length and angle of each line indicate the degree and axis of distortion; short lines indicate smaller ratios of magnification (approaching 1:1); longer linesindicate greater ratios of magnification along the indicated axes that typically run between 1.4:1 and 1.7:1. As one can predict, most of the ocular dominance columns in this region project parallel to the axis representing horizontal, perpendicular to the V1/V2 border. Hence, the average tendency of superimposed vectors to run parallel to the representation of vertical, along the V1/V2 border, supports previous findings. However, these vectors also provide more detail. By revealing local moments of distortion, in increments of 1 mm, the superimposed lines reveal local ratios of magnification in unprecedented detail, and by revealing them in regions where local patterns of ocular dominance also are known, they make it possible to compare ocular dominance columns with local fluctuations in retinotopy. As one can see, they correspond closely. Even a cursory examination reveals similar trends. For example, there is a gentle clockwise rotation in vector angle that occurs from left to right, matching a corresponding rotation in ocular dominance trajectory. b, This image shows the same field of vectors (calculated in Fig. 10) superimposed over an ocular dominance contour plot, derived from iso-intensity values. Whereas ocular dominance trajectories tend to be obvious at large scales, i.e., in regions large enough to contain several repetitions of columns, they are more ambiguous over intervals smaller than single ocular dominance hypercolumns (∼1 mm). However, it is possible to infer them from the gradient of ocular dominance values, which tends to peak at the borders between adjacent columns along axes running perpendicular to ocular dominance column trajectories. Hence, the latter can be estimated from groups of closely spaced contour lines, whose intervals vary inversely with the gradient. By comparing the axis of each vector with that of the nearest group of three or more closely spaced lines, it is possible to estimate angles of intersection, which appear histogrammed inc. c, This histogram shows the distribution of angles at which vectors intersect ocular dominance columns a and b. As one can see, most vectors intersect ocular dominance columns at angles that deviate from perpendicular by <15°, and none deviate from perpendicular by angles >30°. d, This histogram shows a similar result for 52 vectors obtained from a different animal (macaque 2 in Table 1).
Fig. 12.
Fig. 12.
Interaction between ocular dominance columns and retinotopy over two adjacent regions of cortex in macaque V1. These images combine results from two sequential studies of slightly overlapping regions, one located 6 mm posterior to the other, in the same animal (macaque 3). As before, all images have been rotated and inverted to bring the V1/V2 border (indicated by broken lines) into alignment with the vertical midline.a, Images of the vasculature overlying the two regions of cortex that were explored. These two overlapping images are superimposed on a large-scale, faded image of the surrounding vasculature that we used to align the maps. Note that blood vessels continue across the boundary between these regions. b. Patterns of iso-azimuth bands generated in the anterior and posterior regions by vertical apertures. The bands nearest to the V1/V2 border (dashed line) run parallel to it, whereas those further posterior slowly curve away from it, on account of the gradient in magnification. They follow coextensive trajectories at the junction between the anterior and posterior imaged regions, continuing to curve even more until they run perpendicular to the anterior portion of the V1/V2 border. The difference in phase between the anterior and posterior patterns, evident where they join, reflects the different aperture intervals used and the fact that they were obtained at different times (because the eyes or monitor may have moved). Note the contrast with the ocular dominance bands in d, where bands imaged separately in the anterior and posterior regions match closely. c, Patterns of iso-elevation bands in the anterior and posterior regions of cortex. As in b, the bands follow coextensive trajectories, even though they were obtained at different times, and hence with different phases. d,Magnification vectors and ocular dominance columns. The anterior and poster images show differential images of ocular dominance that overlap slightly. Dark bands indicate regions dominated by the right eye, whereas light bands indicate regions dominated by the left eye. Superimposed on each of these patterns are distortion vectors, calculated from grids that were extracted from the patterns in b and c, according to procedures detailed in Figures 8 and 10. Vectors calculated for the anterior region end inarrows, whereas vectors calculated for the posterior region end in circles. Note how these vectors cross ocular dominance columns at right angles, turning where they turn to maintain the correlation. The large arrowheads indicate a rift in the posterior region, where ocular dominance bands change trajectory abruptly, from horizontal in the anterior portion to vertical in the posterior one. Note how the distortion vectors keep pace, turning almost as quickly, and how short they become when ocular dominance columns change direction quickly. e, The histograms appearing below the large image in d indicate the frequencies of particular angles of intersection, between distortion vectors and ocular dominance columns, in the anterior and posterior regions. As one can see, most intersections occur at angles >75°, close to 90°.
Fig. 13.
Fig. 13.
Functional maps of orientation selectivity and retinotopic meridia in V1 and V2 of the squirrel monkey. Each of these images was obtained from the same region of cortex, centered over corresponding regions of V1 and V2, with the border between them oriented vertically through the center. a, Overlying vasculature. In the squirrel monkey, the density of vascularization frequently heralds the transition between V1 and V2. This clearly is evident in this image, which shows a darker V1 on theleft. b, Pattern of orientation preferences for vertical and horizontal. Because this image was obtained by subtracting cortical responses to horizontal stimuli from cortical responses to vertical stimuli, dark andlight regions indicate preferences for vertical and horizontal. Note a clear transition at the V1/V2 border: on theleft, in V1, a fine pattern of dark andlight iso-orientation bands run perpendicular to the V1/V2 border; on the right, in V2, a much coarser organization of orientation selectivity patterns appears to radiate outward, to the right, in thick bands that correlate in location with thick cytochrome oxidase bands (Blasdel et al., 1993; Horton et al., 1996). c, Orientation pattern produced by left and right oblique stimuli. Dark and light zones indicate preference for left and right oblique.d, Iso-orientation contours calculated from eight differential images of orientation (including those in band c). The horizontal trajectories of most lines on the left side of the V1/V2 border confirm the results from band c, that contours of iso-orientation intersect the V1/V2 border at angles of ∼90°. e–h, Patterns of retinotopic position elicited by apertures, 0.7° wide repeated at intervals of 1.4°, and oriented vertically (e), along the left oblique (f), horizontally (g), and along the right oblique (h). The bands in each pattern terminate at the V1/V2 border and all appear to be offset (by 20–30°) from axes defined with respect to the V1/V2 border.
Fig. 14.
Fig. 14.
Patterns of orientation and magnification in the squirrel monkey. a, Iso-azimuth contours superimposed over the bands induced by vertical apertures, from which we extracted them. b, Iso-elevation contours superimposed over bands induced by horizontal apertures. c, Superposition of the grid, constructed from iso-azimuth and iso-elevation contours (a,b), with the differential image of bands induced by apertures inclined at +45° (left oblique). As one can see, these bands run parallel to the thin white lines that connect selected vertices at left oblique angles.d, Superposition of the same grid with the differential image of bands induced by 135° apertures. As one can see, both thelight and dark bands follow the same trajectories as the fine white lines that connect selected vertices at right oblique angles. e, This diagram shows the grid of iso-azimuth and iso-elevation contours up to the V1/V2 border (indicated by vertical line) and the vectors calculated from the circular variance of the quadrangle vertices defined by each quadrangle. As one can see, these vectors still run parallel to the V1/V2 border, although they clearly are much smaller than those obtained from macaque V1 (Figs. 11, 12). Note also how the axes of iso-azimuth and iso-elevation contours, which should run vertical and horizontal, deviate by 20–30° from the axes defined with respect to the V1/V2 border. f, Superposition of the distortion vectors, calculated from the circular variance of each quadrangle, over one differential image of orientation preference obtained from Figure 13b. These clearly run perpendicular to the dark and light bandsthat indicate contours of iso-orientation. g, This histogram shows the distribution of angles at which local distortion vectors intersect axes of iso-orientation at 20 different locations. Many occur at angles approaching 90°. All intersect at angles steeper than 45°.

References

    1. Allman JM, Kaas JH. Representations of the visual field in striate and adjoining cortex of the owl monkey (Aotus trivirgatus). Brain Res. 1971;35:89–106. - PubMed
    1. Blasdel GG. Differential imaging of ocular dominance and orientation selectivity in monkey striate cortex. J Neurosci. 1992a;12:3115–3138. - PMC - PubMed
    1. Blasdel GG. Orientation selectivity, preference, and continuity in monkey striate cortex. J Neurosci. 1992b;12:3141–3163. - PMC - PubMed
    1. Blasdel GG, Fitzpatrick D. Physiological organization of layer 4 in macaque striate cortex. J Neurosci. 1984;4:880–895. - PMC - PubMed
    1. Blasdel GG, Lund JS. Termination of afferent axons in macaque striate cortex. J Neurosci. 1983;3:1389–1413. - PMC - PubMed

Publication types

LinkOut - more resources