Comparative Study
. 2001 Oct;11(10):1660-76.
doi: 10.1101/gr.188201.

Abundance, distribution, and transcriptional activity of repetitive elements in the maize genome

Affiliations
Comparative Study

Abundance, distribution, and transcriptional activity of repetitive elements in the maize genome

B C Meyers et al. Genome Res. 2001 Oct.

Abstract

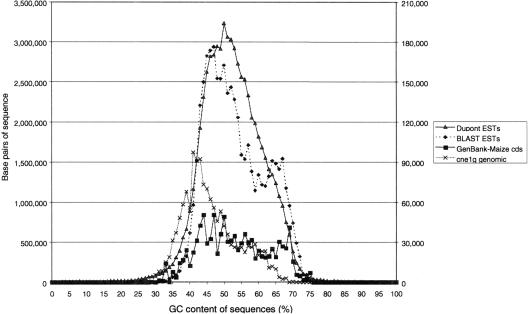
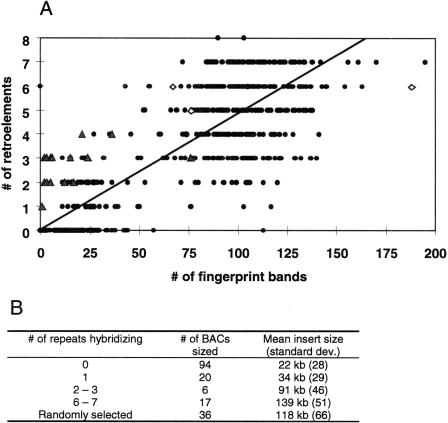
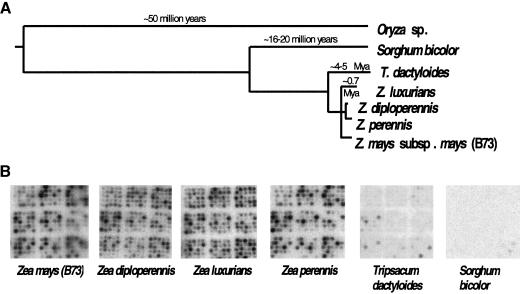
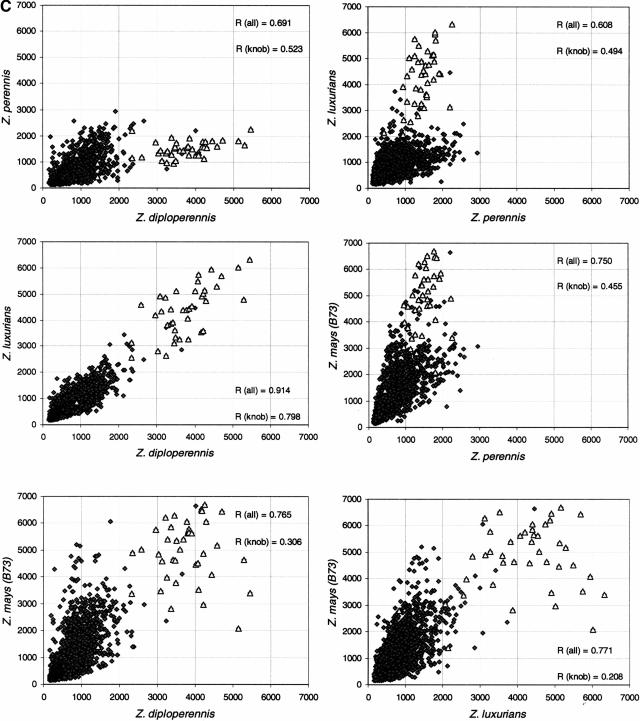
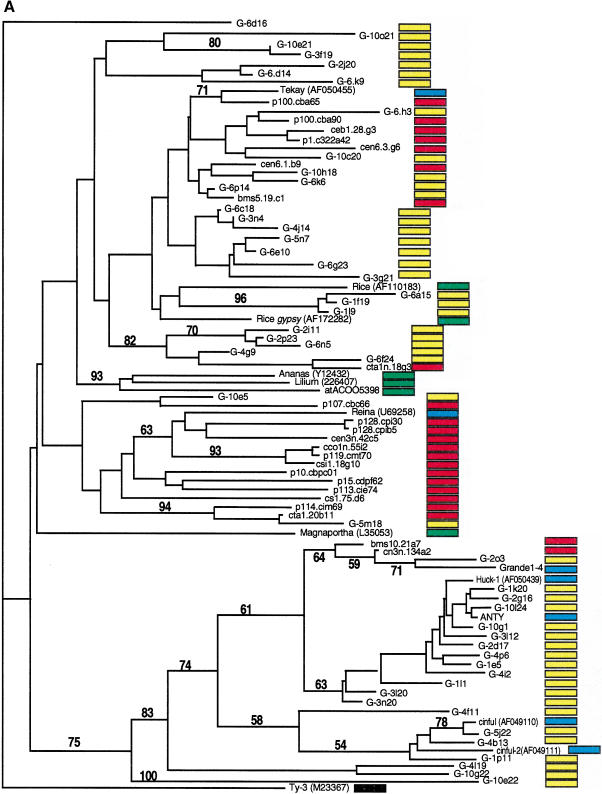
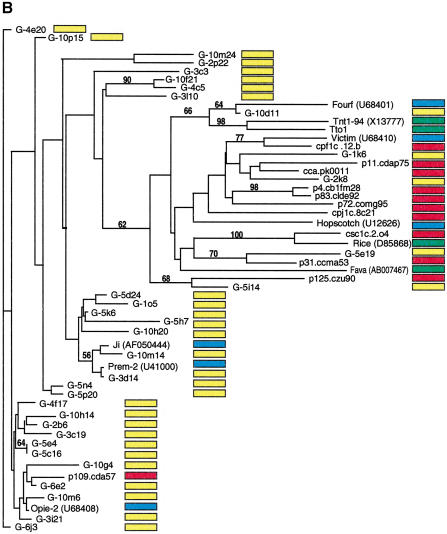
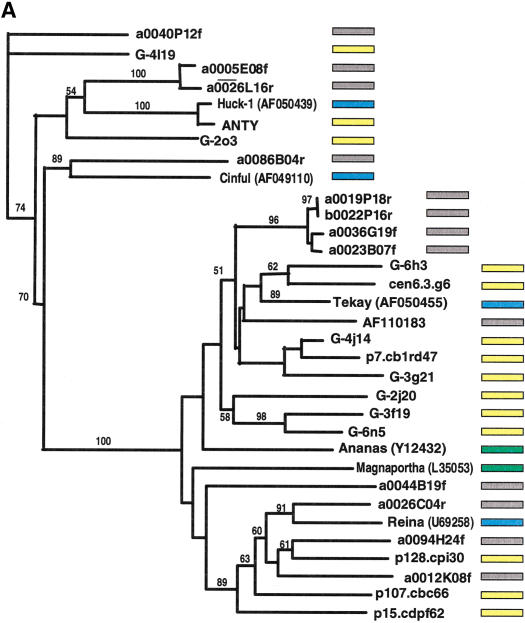
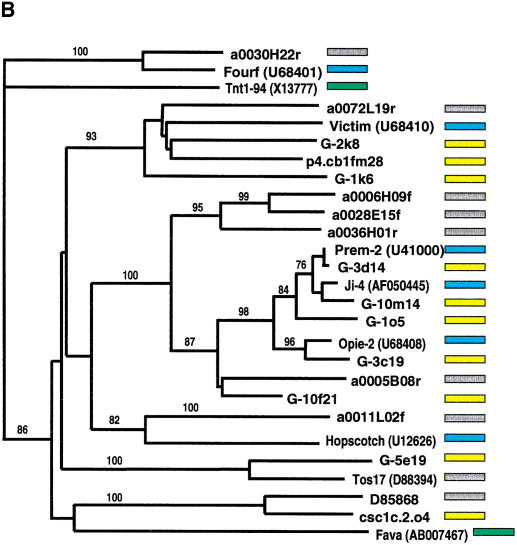
Long terminal repeat (LTR) retrotransposons have been shown to make up much of the maize genome. Although these elements are known to be prevalent in plant genomes of a middle-to-large size, little information is available on the relative proportions composed by specific families of elements in a single genome. We sequenced a library of randomly sheared genomic DNA from maize to characterize this genome. BLAST analysis of these sequences demonstrated that the maize genome is composed of diverse sequences that represent numerous families of retrotransposons. The largest families contain the previously described elements Huck, Ji, and Opie. Approximately 5% of the sequences are predicted to encode proteins. The genomic abundance of 16 families of elements was estimated by hybridization to an array of 10,752 maize bacterial artificial chromosome (BAC) clones. Comparisons of the number of elements present on individual BACs indicated that retrotransposons are in general randomly distributed across the maize genome. A second library was constructed that was selected to contain sequences hypomethylated in the maize genome. Sequence analysis of this library indicated that retroelements abundant in the genome are poorly represented in hypomethylated regions. Fifty-six retroelement sequences corresponding to the integrase and reverse transcriptase domains were isolated from approximately 407,000 maize expressed sequence tags (ESTs). Phylogenetic analysis of these and the genomic retroelement sequences indicated that elements most abundant in the genome are less abundant at the transcript level than are more rare retrotransposons. Additional phylogenies also demonstrated that rice and maize retrotransposon families are frequently more closely related to each other than to families within the same species. An analysis of the GC content of the maize genomic library and that of maize ESTs did not support recently published data that the gene space in maize is found within a narrow GC range, but does indicate that genic sequences have a higher GC content than intergenic sequences (52% vs. 47% GC).


Figures

Figure 1
Figure 1
Distribution of GC content in maize genomic and genic sequences. GC content was calculated for sequences from the cne1g maize random genomic library, for maize-coding sequences present in GenBank, for a random set of maize EST sequences from the DuPont database, and for a subset of the DuPont EST sequences that have high BLAST homologies. The relative abundance of sequences was plotted with bins of 1% GC content. The scales on y-axes refer to the total number of base pairs in each GC-content bin; DuPont ESTs are plotted according to the left y-axis, all other data refer to values on the right y-axis.
Figure 2
Figure 2
Number of hybridizing repetitive elements versus BAC clone size and complexity. BACs (652) from a high-density array were scored for the presence or absence of seven common retroelements (Huck, Prem-2, Opie, Grande, Prem-1, Zeon-1, and ANLI). (A) Repetitive elements versus number of BAC fingerprint bands. The 652 BACs were subjected to a fingerprinting reaction and the number of bands were counted and plotted; the diagonal line indicates the best-fit line for the data, with R2=0.6927 (P=0.000). (▴) BACs that are positive for the centromeric CentC repeat; (⋄) BACs that are positive for the knob 180 bp repeat. (B) Repetitive elements versus BAC clone size. A subset of the 652 BAC clones was sized by pulsed field gel analysis.
Figure 3
Figure 3
Hybridization of genomic DNA to gridded small-insert library. (A) Phylogenetic tree demonstrating relationship of species for which genomic DNA was used as probes for the small insert library. The tree is based on data from Hilton and Gaut (1998). The branch lengths indicate time since divergence with time estimates denoted above. (B) Examples of hybridization patterns for 108 clones spotted in a nonregular duplicate arrangement. The center spot of each 5×5 grid contains λ DNA, which was not included in the probe mixture. (C) Pairwise comparisons of hybridization data to the cne1g library for the Zea probes: Z. luxurians, Z. diploperennis, Z. mays (B73), and Z. perennis. Each clone is plotted according to hybridization intensity in two species. Clones containing knob repeats are indicated by open triangles. The correlation coefficient R is shown either for all clones or for those containing knob repeats only.
Figure 3
Figure 3
Hybridization of genomic DNA to gridded small-insert library. (A) Phylogenetic tree demonstrating relationship of species for which genomic DNA was used as probes for the small insert library. The tree is based on data from Hilton and Gaut (1998). The branch lengths indicate time since divergence with time estimates denoted above. (B) Examples of hybridization patterns for 108 clones spotted in a nonregular duplicate arrangement. The center spot of each 5×5 grid contains λ DNA, which was not included in the probe mixture. (C) Pairwise comparisons of hybridization data to the cne1g library for the Zea probes: Z. luxurians, Z. diploperennis, Z. mays (B73), and Z. perennis. Each clone is plotted according to hybridization intensity in two species. Clones containing knob repeats are indicated by open triangles. The correlation coefficient R is shown either for all clones or for those containing knob repeats only.
Figure 4
Figure 4
Phylogenetic analysis of LTR-retrotransposon sequences in maize ESTs and genomic sequences. All DNA sequences were translated into proteins and trimmed, and phylogenetic analyses were performed using the neighbor-joining algorithm from distance matrices according to Kimura's two-parameter method. Branch lengths are proportional to genetic distance. Bootstrap values >50 are indicated as a percentage of 1000 replicates. Maize genomic sequences from the cne1g genomic library are indicated by a yellow box to the right of the sequence; maize cDNA sequences from the DuPont database by a red box; previously described maize retroelements by a blue box; and retroelements from other species by a green box. (A) Gypsy-related sequences. Predicted proteins were homologous to a 132-amino acid region of the integrase domain. (B, next page) Copia-related sequences. Predicted proteins were homologous to a 92-amino acid region of the reverse transcriptase domain.
Figure 4
Figure 4
Phylogenetic analysis of LTR-retrotransposon sequences in maize ESTs and genomic sequences. All DNA sequences were translated into proteins and trimmed, and phylogenetic analyses were performed using the neighbor-joining algorithm from distance matrices according to Kimura's two-parameter method. Branch lengths are proportional to genetic distance. Bootstrap values >50 are indicated as a percentage of 1000 replicates. Maize genomic sequences from the cne1g genomic library are indicated by a yellow box to the right of the sequence; maize cDNA sequences from the DuPont database by a red box; previously described maize retroelements by a blue box; and retroelements from other species by a green box. (A) Gypsy-related sequences. Predicted proteins were homologous to a 132-amino acid region of the integrase domain. (B, next page) Copia-related sequences. Predicted proteins were homologous to a 92-amino acid region of the reverse transcriptase domain.
Figure 5
Figure 5
Phylogenetic analysis of LTR-retrotransposon sequences in rice and maize. All DNA sequences were translated into proteins and trimmed to the respective domains, and phylogenetic analyses were performed using the neighbor-joining algorithm from distance matrices according to Kimura's two-parameter method. Branch lengths are proportional to genetic distance. Bootstrap values >50 are indicated as a percentage of 1000 replicates. Maize sequences are indicated by a yellow box to the right of the sequence; rice sequences by a gray box; maize retroelements described previously by a blue box; and retroelements from other species by a green box. The maize sequences were a subset of those in Fig. 4, chosen to represent the major clades on the trees in Fig. 4. Rice sequences with a number preceded by a00 or b00 are from the Clemson University Genome Center (http://www.genome.clemson.edu/); for display purposes, the Clemson sequence identifier OSJNB has been removed from these sequence names. (A) Gypsy-related sequences. Predicted proteins were homologous to a 132-amino acid region of the integrase domain. (B) Copia-related sequences. Predicted proteins were homologous to a 92-amino acid region of the reverse transcriptase domain.
Figure 5
Figure 5
Phylogenetic analysis of LTR-retrotransposon sequences in rice and maize. All DNA sequences were translated into proteins and trimmed to the respective domains, and phylogenetic analyses were performed using the neighbor-joining algorithm from distance matrices according to Kimura's two-parameter method. Branch lengths are proportional to genetic distance. Bootstrap values >50 are indicated as a percentage of 1000 replicates. Maize sequences are indicated by a yellow box to the right of the sequence; rice sequences by a gray box; maize retroelements described previously by a blue box; and retroelements from other species by a green box. The maize sequences were a subset of those in Fig. 4, chosen to represent the major clades on the trees in Fig. 4. Rice sequences with a number preceded by a00 or b00 are from the Clemson University Genome Center (http://www.genome.clemson.edu/); for display purposes, the Clemson sequence identifier OSJNB has been removed from these sequence names. (A) Gypsy-related sequences. Predicted proteins were homologous to a 132-amino acid region of the integrase domain. (B) Copia-related sequences. Predicted proteins were homologous to a 92-amino acid region of the reverse transcriptase domain.

References

    1. Abranches R, Beven AF, Aragon-Alcaide L, Shaw PJ. Transcription sites are not correlated with chromosome territories in wheat nuclei. J Cell Biol. 1998;143:5–12. - PMC - PubMed
    1. Altschul SF, Madden TL, Schaffer AA, Zhang J, Zhang Z, Miller W, Lipman DJ. Gapped BLAST and PSI-BLAST: A new generation of protein database search programs. Nucleic Acids Res. 1997;25:3389–3402. - PMC - PubMed
    1. Ananiev EV, Phillips RL, Rines HW. Chromosome-specific molecular organization of maize (Zea maysL.) centromeric regions. Proc Natl Acad Sci. 1998a;95:13073–13078. - PMC - PubMed
    1. ————— Complex structure of knob DNA on maize choromosome 9: Retrotransposon invasion into heterochromatin. Genetics. 1998b;149:2025–2037. - PMC - PubMed
    1. Arumuganathan K, Earle ED. Nuclear DNA content of some important plant species. Plant Mol Biol Rep. 1991;9:208–218.

Publication types