. 2001 Oct 23;98(22):12468-72.
doi: 10.1073/pnas.211400898. Epub 2001 Oct 9.

A high-speed atomic force microscope for studying biological macromolecules

Affiliations

A high-speed atomic force microscope for studying biological macromolecules

T Ando et al. Proc Natl Acad Sci U S A. .

Abstract

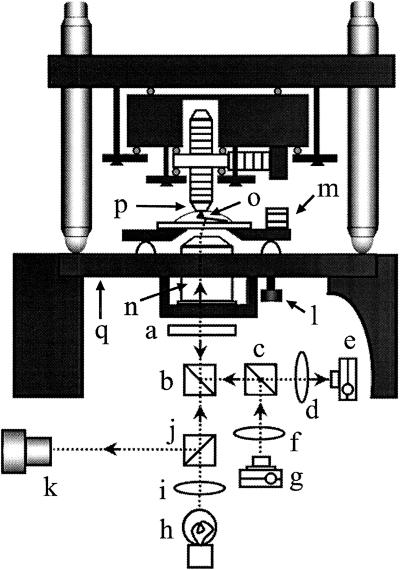
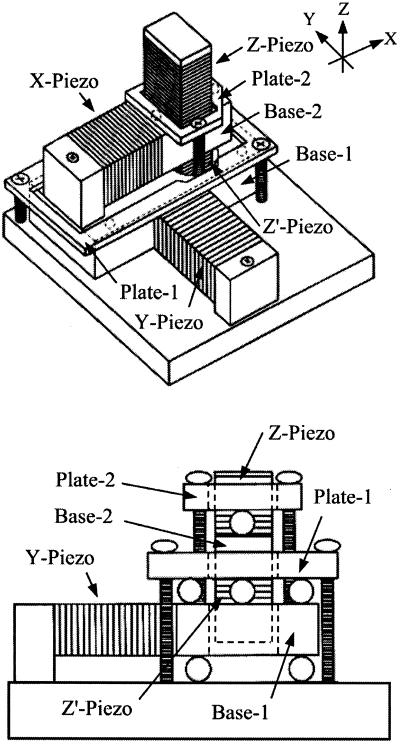
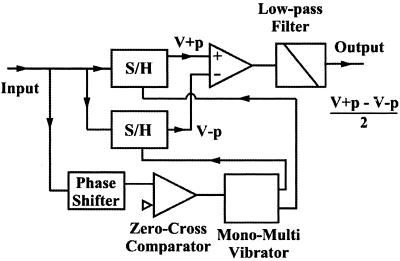
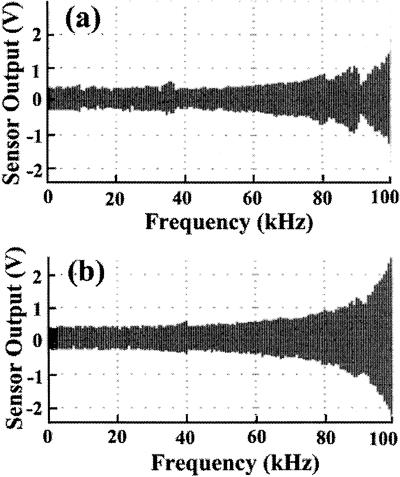
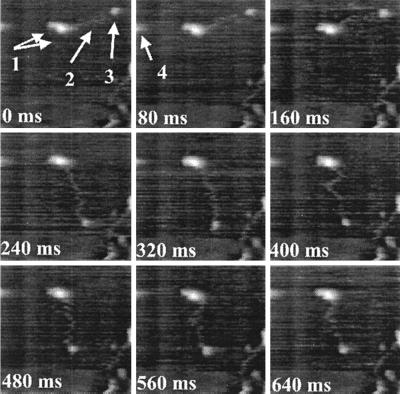
The atomic force microscope (AFM) is a powerful tool for imaging individual biological molecules attached to a substrate and placed in aqueous solution. At present, however, it is limited by the speed at which it can successively record highly resolved images. We sought to increase markedly the scan speed of the AFM, so that in the future it can be used to study the dynamic behavior of biomolecules. For this purpose, we have developed a high-speed scanner, free of resonant vibrations up to 60 kHz, small cantilevers with high resonance frequencies (450-650 kHz) and small spring constants (150-280 pN/nm), an objective-lens type of deflection detection device, and several electronic devices of wide bandwidth. Integration of these various devices has produced an AFM that can capture a 100 x 100 pixel(2) image within 80 ms and therefore can generate a movie consisting of many successive images (80-ms intervals) of a sample in aqueous solution. This is demonstrated by imaging myosin V molecules moving on mica (see http://www.s.kanazawa-u.ac.jp/phys/biophys/bmv_movie.htm).


Figures

Figure 1
Figure 1
Schematic drawing of the AFM head integrated with an inverted type of optical microscope. (a) λ/4 Plate. (b) Dichroic mirror. (c) Polarization beam splitter. (d) Focusing lens. (e) Split photodiode. (f) Collimator lens. (g) Laser diode. (h) Illumination lamp. (i) Collimator lens. (j) Half mirror. (k) Viewing system of the optical microscope. (l) Screw for adjusting the cantilever height. (m) Piezo for exciting cantilever. (n) Objective lens. (o) Cantilever. (p) Sample stage. (q) Sample stage of the optical microscope. All of the components (ag and n) of the deflection detection system are hung down from the sample stage of the optical microscope. The scanner (see Fig. 2 also) is mounted on the same sample stage. The collimated laser beam is reflected up, incident on the objective lens at an off-centered position. The outgoing beam thus tilted about 10o from the vertical plane is focused onto the cantilever whose plane is tilted about 10o from the horizontal plane. The beam reflected at the cantilever is collimated by the objective lens, separated from the incident beam by the polarization beam splitter with λ/4 wave plate, and reflected onto the split photodiode. The optical microscope allows us to view the cantilever and the focused laser spot. The specimen is supported at the bottom of the sample stage (p), and an inverted cantilever (o) probes the specimen from below.
Figure 2
Figure 2
Scanner assembly. (Lower) The side view when looked at the scanner from +x to −x. The scanner has a two-layered structure that guarantees that the x-scan and the y-scan do not interfere with each other. For structural details, see the text.
Figure 3
Figure 3
Circuit for fast amplitude measurement. The output sinusoidal signal from the split-photodiode amplifier is fed to this circuit. The output of this circuit provides the amplitude of the sinusoidal input signal at periodicity of the input signal. For details, see the text.
Figure 4
Figure 4
Oscillation of the z-scanner as a function of the driving frequency. The amplitude of the driving signal was kept constant while sweeping its frequency. The data were obtained with (b) or without (a) operating the z-piezo for the counterbalance.
Figure 5
Figure 5
Successive images of myosin V on mica in buffer solution. The same area of 240 × 240 nm2 was imaged 50 times with 100 × 100 pixels. Only nine successive images are shown. The tip speed is 0.6 mm/s (scan rate, 1.25 kHz), and the frame rate is 12.5/s. The tapping frequency is 620 kHz, the amplitude of the cantilever's free oscillation is 12 nm, and the set point is about 11.5 nm. In the first image, the head/neck regions, the long tail, and the globular tail end are marked with arrow 1, arrow 2, and arrow 3, respectively. A mirror image of one of the head region is marked with arrow-4 in the second image. The still panels here appear noisier than the dynamic images in the movie on the web site http://www.s.kanazawa-u.ac.jp/phys/biophys/bmv_movie.htm. The two head/neck regions are overlapped in the z direction, and therefore, they are not well resolved and do not show a typical “Y” shape. Dynamic images of myosin V that show “Y” shape are also presented at http://www.s.kanazawa-u.ac.jp/phys/biophys/bmv_movie.htm.

References

    1. Binnig G, Quate C F, Gerber C. Phys Rev Lett. 1986;56:930–933. - PubMed
    1. Drake B, Prater C B, Weisenhorn A L, Gould S A, Albrecht T R, Quate C F, Cannell D S, Hansma H G, Hansma P K. Science. 1989;243:1586–1589. - PubMed
    1. Bustamante C, Rivetti C, Keller D J. Curr Opin Struct Biol. 1997;7:709–716. - PubMed
    1. Guthold M, Bezanilla M, Eire D A, Jenkins B, Hansma H G, Bustamante C. Proc Natl Acad Sci USA. 1994;91:12927–12931. - PMC - PubMed
    1. Kassas S, Thomson N H, Smith B L, Hansma H G, Zhu X, Guthold M, Bustamante C, Kool E T, Kashlev M, Hansma P K. Biochemistry. 1997;36:461–468. - PubMed

Publication types