. 2001 Oct 9;98(21):12044-9.
doi: 10.1073/pnas.221430898. Epub 2001 Oct 2.

The human decatenation checkpoint

Affiliations

The human decatenation checkpoint

P B Deming et al. Proc Natl Acad Sci U S A. .

Abstract

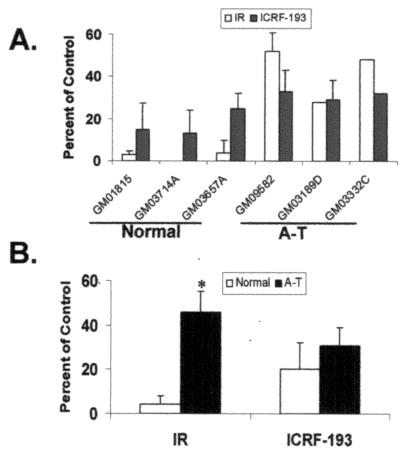
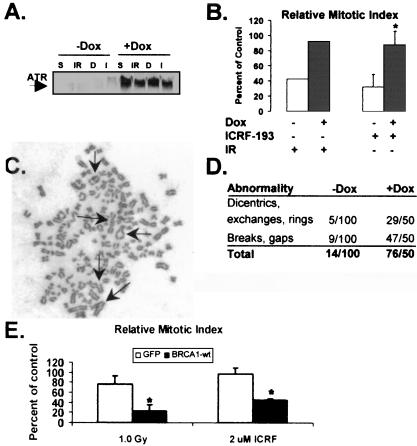
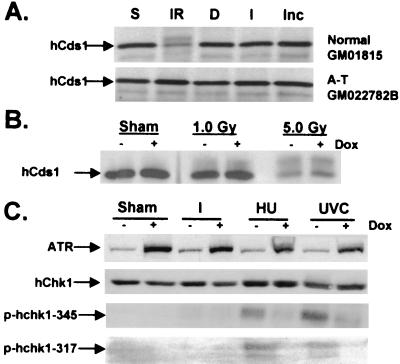
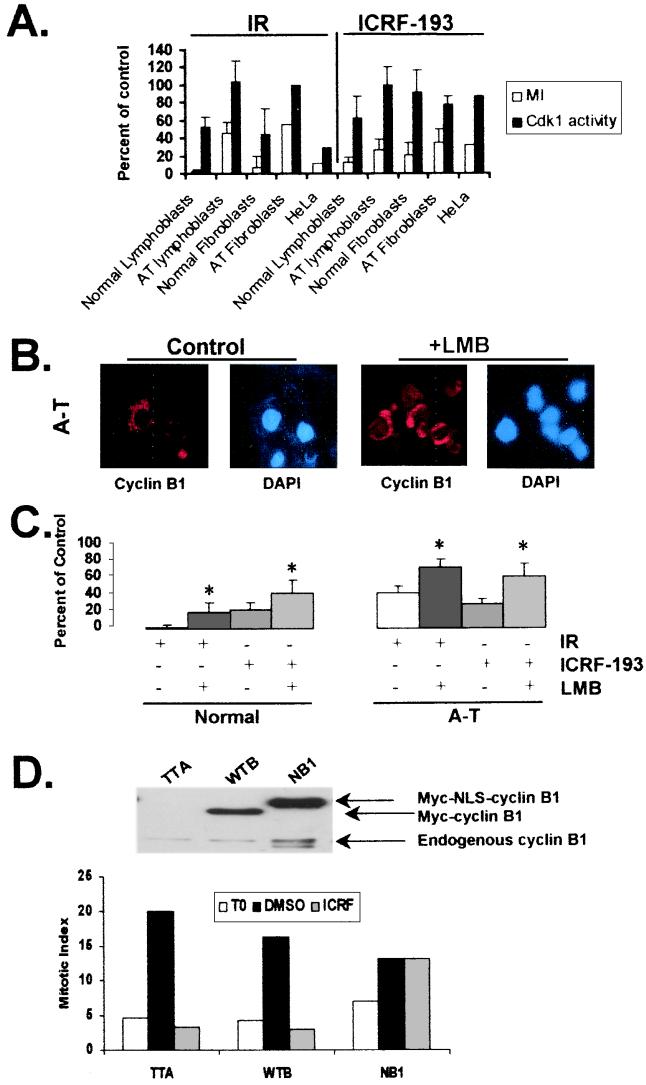
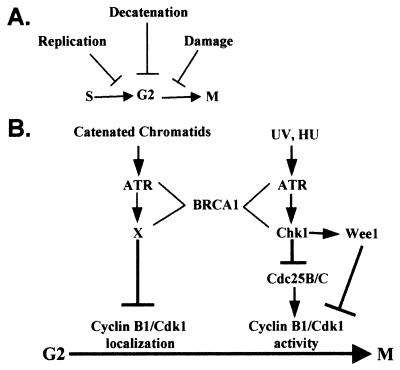
Chromatid catenation is actively monitored in human cells, with progression from G(2) to mitosis being inhibited when chromatids are insufficiently decatenated. Mitotic delay was quantified in normal and checkpoint-deficient human cells during treatment with ICRF-193, a topoisomerase II catalytic inhibitor that prevents chromatid decatenation without producing topoisomerase-associated DNA strand breaks. Ataxia telangiectasia (A-T) cells, defective in DNA damage checkpoints, showed normal mitotic delay when treated with ICRF-193. The mitotic delay in response to ICRF-193 was ablated in human fibroblasts expressing an ataxia telangiectasia mutated- and rad3-related (ATR) kinase-inactive ATR allele (ATR(ki)). BRCA1-mutant HCC1937 cells also displayed a defect in ICRF-193-induced mitotic delay, which was corrected by expression of wild-type BRCA1. Phosphorylations of hCds1 or Chk1 and inhibition of Cdk1 kinase activity, which are elements of checkpoints associated with DNA damage or replication, did not occur during ICRF-193-induced mitotic delay. Over-expression of cyclin B1 containing a dominant nuclear localization signal, and inhibition of Crm1-mediated nuclear export, reversed ICRF-193-induced mitotic delay. In combination, these results imply that ATR and BRCA1 enforce the decatenation G(2) checkpoint, which may act to exclude cyclin B1/Cdk1 complexes from the nucleus. Moreover, induction of ATR(ki) produced a 10-fold increase in chromosomal aberrations, further emphasizing the vital role for ATR in genetic stability.


Figures

Figure 1
Figure 1
Sustained chromatid catenation induces mitotic delay in normal and A-T cells. (A) Normal and A-T lymphoblasts were sham-treated, irradiated with 1 Gy of γ-rays (IR), incubated in 2 μM ICRF-193, or incubated with DMSO solvent. Two hours after treatment or addition of drug, mitotic index was quantified as described in Materials and Methods. The results for IR and ICRF-193 are expressed as a percentage of the untreated control (mean + SD; n = 3–4 for all but GM03332C, where n = 2). (B) The mean values obtained in A were expressed as the average percentage of the untreated control for normal and A-T cells (mean + SD, n = 3). *, The mean inhibition of mitosis in A-T cells after IR was significantly less than in normal cells (Student's t test, P < 0.05).
Figure 2
Figure 2
ATR and BRCA1 are required for ICRF-193-induced mitotic delay. (A) Uninduced or induced GM847 cells were irradiated with 1.0 Gy of γ-rays (IR) or incubated with 2 μM ICRF-193 (I). Sham-treated and DMSO controls are denoted S and D, respectively. After 2 h, cells were harvested and Western immunoblot analysis was performed. (B) Uninduced (open bars) and induced GM847 (closed bars) cells were treated as described above. After 2 h, cells were assayed for mitosis. The results are expressed as the mean percentage of the untreated control (+ SD, for ICRF-193, n = 3; for IR, n = 2). *, The mean inhibition of mitosis in uninduced ICRF-193-treated cells was significantly different from that in induced ICRF-193-treated cells (Student's t test, P < 0.005). (C and D) Metaphase spreads of chromosomes from ATRki-induced GM847 cells. Arrows point to various chromosomal aberrations. (E) HCC1937 cells expressing GFP or BRCA1wt were irradiated with 1.0 Gy of γ-rays or incubated with 2 μM ICRF-193. After 2 h, cells were assayed for mitosis. The results are expressed as the mean percentage of the untreated control (+ SD, for ICRF-193, n = 3; for IR, n = 2). *, The mean inhibition of mitosis in GFP- expressing cells was significantly different from that in BRCA1wt-expressing cells (Student's t test, P < 0.005).
Figure 3
Figure 3
ICRF-193 does not induce phosphorylation of hCds1 or hChk1. (A) Normal and A-T lymphoblasts were sham-treated (S) or irradiated with 5 Gy of γ-rays (IR), incubated with DMSO solvent (D), incubated with 2 μM ICRF-193 (I), or retained untreated in the incubator (Inc). One hour after treatment or addition of drug, cells were harvested. (B) Uninduced or induced GM847 cells were harvested 2 h after sham treatment or irradiation with 1.0 or 5.0 Gy. Western immunoblot analysis was performed for expression of hCds1. (C) Uninduced or induced GM847 cells were harvested 2 h after sham treatment, irradiation with 50 J/m2 UVC, or incubation with 2 mM HU or 2 μM ICRF-193 (I). IP-Western or Western blot analysis was performed for expression of ATR, Chk1, and Ser-345- or -317-phosphorylated Chk1.
Figure 4
Figure 4
Nuclear cyclin B1 abrogates ICRF-193-induced mitotic delay. (A) Human cell lines (normal and A-T lymphoblasts and fibroblasts, HeLa) were irradiated or incubated with ICRF-193 or DMSO. Two hours after treatment or addition of drug, cells were harvested and assayed for mitotic index and Cdk1 kinase activity. The results are expressed as a percentage of the untreated control. There was not a significant correlation between the reduction in mitotic index and Cdk1 kinase activity after incubation with ICRF-193 (R2 = 0.03, P > 0.5). (B) Normal and A-T lymphoblastoid cell lines were treated with and without 6 ng/ml of LMB for 2 h, after which cells were fixed onto glass slides and immunofluorescence microscopy was performed. Representative images are shown for GM03189D (A-T). (C) Normal (GM03714A, GM01815, and GM03657A) and A-T lymphoblasts (GM09582, GM03189D, and GM03332C) were pretreated with and without 6 ng/ml of LMB and then were sham-treated, irradiated with 1 Gy of γ-rays, or incubated with 2 μM ICRF-193 or DMSO. Two hours after treatment or addition of drug, mitotic index was quantified. The results are expressed as the average percentage of control mitotic index in normal or A-T cells. (mean + SD, n = 3 for IR and n = 5 for ICRF-193). *, The mean inhibition of mitosis in LMB-treated cells was significantly different from the mean inhibition of mitosis in IR- or ICRF-193-treated normal and A-T cells (Student's t test, P < 0.05). (D) Log-phase NHF1hTERT cells were infected with adenovirus containing tetracycline transactivator (TTA) alone or coinfected with TTA and wt cyclin B1 (WTB) or cyclin B1 containing a dominant nuclear localization sequence (NB1). Twelve hours after infection, cells were harvested for cyclin B1 Western blot analysis, fixed for mitotic index determination, or incubated with DMSO or 2 μM ICRF-193 in the presence of 100 ng/ml of colcemid. After 6 h, cells were fixed and mitotic index was determined. The results are expressed as the percentage of mitotic cells at time of addition of DMSO or ICRF-193 (T0) and after 6 h of incubation in colcemid and ICRF-193 or DMSO. The results depicted were reproduced in two additional experiments.
Figure 5
Figure 5
(A) Mitotic entry checkpoints. (B) Model for ATR-dependent G2 checkpoint function.

Similar articles

Cited by

References

    1. Hartwell L H, Kastan M B. Science. 1994;266:1821–1828. - PubMed
    1. Kaufmann W K, Paules R S. FASEB J. 1996;10:238–247. - PubMed
    1. Paulovich A G, Toczyski D P, Hartwell L H. Cell. 1997;88:315–321. - PubMed
    1. Hartwell L H, Weinert T A. Science. 1989;246:629–634. - PubMed
    1. Ohtsubo M, Kai R, Furuno N, Sekiguchi T, Sekiguchi M, Hayashida H, Kuma K, Miyata T, Fukushige S, Murotsu T. Genes Dev. 1987;1:585–593. - PubMed

Publication types

MeSH terms

Substances