. 2001 Oct 9;98(21):12114-9.
doi: 10.1073/pnas.201413098. Epub 2001 Oct 2.

Identification of a conserved erythroid specific domain of histone acetylation across the alpha-globin gene cluster

Affiliations

Identification of a conserved erythroid specific domain of histone acetylation across the alpha-globin gene cluster

E Anguita et al. Proc Natl Acad Sci U S A. .

Abstract

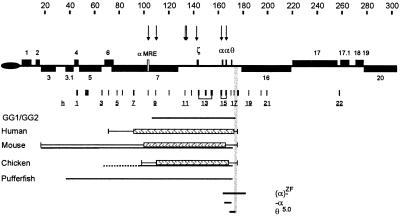
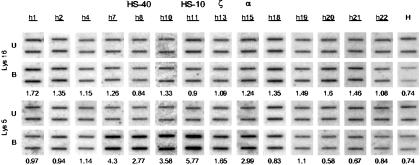
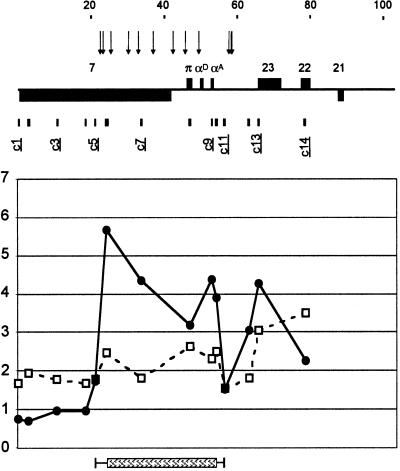
We have analyzed the pattern of core histone acetylation across 250 kb of the telomeric region of the short arm of human chromosome 16. This gene-dense region, which includes the alpha-globin genes and their regulatory elements embedded within widely expressed genes, shows marked differences in histone acetylation between erythroid and non-erythroid cells. In non-erythroid cells, there was a uniform 2- to 3-fold enrichment of acetylated histones, compared with heterochromatin, across the entire region. In erythroid cells, an approximately 100-kb segment of chromatin encompassing the alpha genes and their remote major regulatory element was highly enriched in histone H4 acetylated at Lys-5. Other lysines in the N-terminal tail of histone H4 showed intermediate and variable levels of enrichment. Similar broad segments of erythroid-specific histone acetylation were found in the corresponding syntenic regions containing the mouse and chicken alpha-globin gene clusters. The borders of these regions of acetylation are located in similar positions in all three species, and a sharply defined 3' boundary coincides with the previously identified breakpoint in conserved synteny between these species. We have therefore demonstrated that an erythroid-specific domain of acetylation has been conserved across several species, encompassing not only the alpha-globin genes but also a neighboring widely expressed gene. These results contrast with those at other clusters and demonstrate that not all genes are organized into discrete regulatory domains.


Figures

Figure 1
Figure 1
The telomeric region of human chromosome 16. Telomeric repeats (TTAGGG)n are represented by an oval. Genes surrounding the α cluster are shown as gray boxes and numbered as in ref. . The direction of transcription toward the centromere (above the line) or telomere (below the line) is indicated. The αMRE is shown as an open box. Erythroid-specific DNase1 HSs are represented as arrows above the chromosome. The scale is in kilobases. Probes used to assess the pattern of core histone acetylation are shown as underlined numbered boxes below the chromosome (for clarity not all probes are numbered in the figure). The extent of the previously described 70-kb construct (GG1/GG2) used to make transgenic mice (10) is shown as a horizontal line. The domains of acetylation (hatched box) in human, mouse, and chicken are shown, and the regions in which a transition occurs from hyperacetylated to normally acetylated chromatin are indicated by thin horizontal lines. The segments corresponding to conserved syntenic regions in mouse and chicken and pufferfish are shown as continuous horizontal lines below the acetylation domains. The dashed line in the chicken cluster represents DNA that has been mapped but not sequenced. The region containing the 3′ acetylation boundary is indicated by gray shading, and the extents of deletions described in the text are shown. The extent of the θ5.0 deletion (168,996–169,014 to 173,925–173,943; there are 19 bases identical at both ends because the recombination occurred between two Alu repeats) was accurately determined as part of this study (see Materials and Methods).
Figure 2
Figure 2
The patterns of core histone acetylation across the human α-globin cluster with the probes used set out below annotated as in Fig. 1 and described in detail in Table 1, which is published as supporting information on the PNAS web site, www.pnas.org. The scale is in kilobases. Acetylation of histone H4 at Lys-16 (white boxes and dashed line) and Lys-5 (black circles and black line) in (a) human EBV-transformed B lymphocytes, (b) fibroblasts, (c) K562, and (d) primary human erythroid progenitors. Levels of acetylation at control loci were established independently for each experiment and include the α-tubulin genes (T), a probe to heterochromatin repeat sequences (het 266) (H), human rDNA (R), a probe directed to a heterochromatic Y chromosome repeat (D), which is also present on the X chromosome, and a probe to the human γ-globin gene (G). The putative boundaries of acetylation are indicated by vertical black lines. Gray lines indicate the position of the erythroid-specific HSs.
Figure 3
Figure 3
Slot blots used to calculate the ratios (corrected for loading) of bound/unbound chromatin in the ChIP assays for primary erythroid cells. The probes used are annotated as in Fig. 1. The ratio of bound(B)/unbound(U) chromatin at each point (average of three or four doubling dilutions) by using antibodies against H4 Lys-5 and Lys-16 is shown below. Examples of the controls by using the het 266 probe (H) for the corresponding experiment are shown. The values plotted in Figs. 2 and 4 are the averages of these and other ChIP experiments.
Figure 4
Figure 4
Analysis of acetylation of the core histone H4 at Lys-16 (black), Lys-12 (gray), Lys-8 (white), Lys-5 (red), and H3 at Lys-14 (blue) in EBV-transformed lymphoblasts (a) and primary erythroblasts (b). The probes correspond to the annotation in Fig. 1. Error bars correspond to +1 SD. For full analyses of similar data for each experiment described here, see Fig. 7.
Figure 5
Figure 5
The pattern of histone H4 acetylation across the murine α-globin locus in mouse erythroleukemia cells. (a) Above, the structure of the murine locus is set out as previously described (15). The globin genes are annotated, and other orthologous genes correspond to the human genes set out in Fig. 1 (e.g., murine no. 7 is the orthologue of human no. 7). The probes used to establish the patterns of core histone acetylation across the murine αglobin cluster are described in Table 1. The scale is in kilobases. The asterisk denotes a hypersensitive site that is assumed to be present but has not been experimentally demonstrated. Acetylation of the core histone H4 at Lys-16 (white boxes and dashed line) and Lys-5 (black circles and black line) is shown. The levels of acetylation for other N-terminal tail lysines are displayed in Fig. 7. Levels of acetylation at control loci were established independently for each experiment and include the α-tubulin genes (T) and a probe (het 947) to heterochromatin repeat sequences (H). (b) The levels of acetylation of Lys-5 and Lys-16 across the putative 3′ boundary were assessed in seven entirely independent experiments. The results obtained with a probe (m8: 123,063–124,463 and 135,985–137,367) to the α-globin gene are shown as a diagonally striped box and those by using a probe beyond the putative boundary (m9: 141886–142293) as a vertically striped box. Vertical lines indicate ±1 SD.
Figure 6
Figure 6
The pattern of histone H4 acetylation across the chicken α-globin locus in HD3 cells. Above, the structure of the chicken locus is set out as described in ref. . The previously mapped positions of erythroid-specific DNase I hypersensitive sites are shown by vertical arrows. The globin genes are annotated, and other orthologous genes correspond to the human genes set out in Fig. 1 (e.g., chicken no. 7 is the orthologue of human no. 7). The probes used to establish the patterns of core histone acetylation across the chicken α-globin cluster are set out in Table 1. The scale is in kilobases. Acetylation of the core histone H4 at Lys-16 (white boxes and dashed line) and Lys-5 (black circles and black line) is shown. The levels of acetylation for other N-terminal tail lysines are displayed in Fig. 7.

References

    1. Wolffe A, editor. Chromatin: Structure and Function. London: Academic; 1995.
    1. Bell A C, Felsenfeld G. Curr Opin Genet Dev. 1999;9:191–198. - PubMed
    1. Udvardy A. EMBO J. 1999;18:1–8. - PMC - PubMed
    1. Bell A C, West A G, Felsenfeld G. Science. 2001;291:447–450. - PubMed
    1. Flint J, Thomas K, Micklem G, Raynham H, Clark K, Doggett N A, King A, Higgs D R. Nat Genet. 1997;15:252–257. - PubMed

Publication types

LinkOut - more resources