

Different patterns of human discrimination learning for two interaural cues to sound-source location
- PMID: 11593048
- PMCID: PMC59810
- DOI: 10.1073/pnas.211220498
Different patterns of human discrimination learning for two interaural cues to sound-source location
Abstract
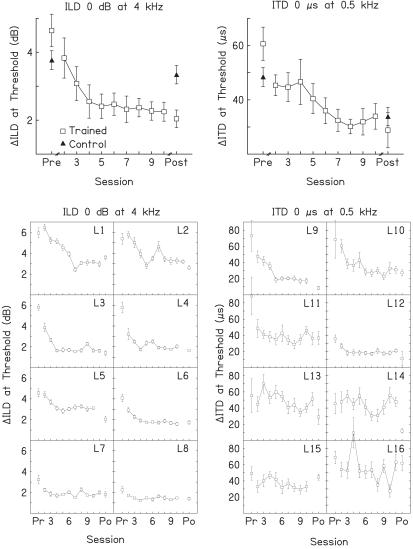
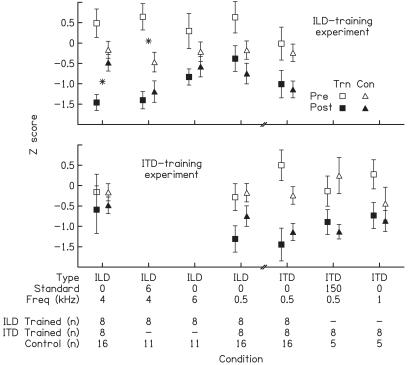
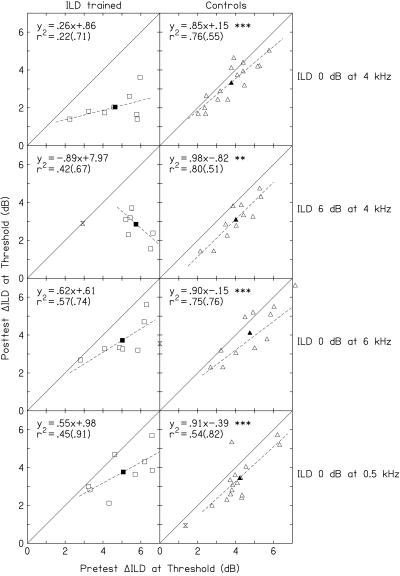
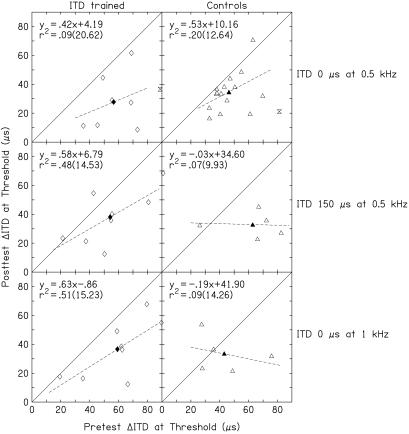
Two of the primary cues used to localize the sources of sounds are interaural level differences (ILDs) and interaural time differences (ITDs). We conducted two experiments to explore how practice affects the human discrimination of values of ILDs and ongoing ITDs presented over headphones. We measured discrimination thresholds of 13 to 32 naive listeners in a variety of conditions during a pretest and again, 2 weeks later, during a posttest. Between those two tests, we trained a subset of listeners 1 h per day for 9 days on a single ILD or ITD condition. Listeners improved on both ILD and ITD discrimination. Improvement was initially rapid for both cue types and appeared to generalize broadly across conditions, indicating conceptual or procedural learning. A subsequent slower-improvement stage, which occurred solely for the ILD cue, only affected conditions with the trained stimulus frequency, suggesting that stimulus processing had fundamentally changed. These different learning patterns indicate that practice affects the attention to, or low-level encoding of, ILDs and ITDs at sites at which the two cue types are processed separately. Thus, these data reveal differences in the effect of practice on ILD and ITD discrimination, and provide insight into the encoding of these two cues to sound-source location in humans.
Figures
Comment in
-
Perceptual training: a tool for both modifying the brain and exploring it.Proc Natl Acad Sci U S A. 2001 Oct 9;98(21):11842-3. doi: 10.1073/pnas.221461598. Proc Natl Acad Sci U S A. 2001. PMID: 11592994 Free PMC article. Review. No abstract available.
Similar articles
-
Discrimination thresholds for interaural-time differences and interaural-level differences in naïve listeners: Sex differences and learning.Hear Res. 2022 Oct;424:108599. doi: 10.1016/j.heares.2022.108599. Epub 2022 Aug 24. Hear Res. 2022. PMID: 36063641
-
Interaural time and level difference thresholds for acoustically presented signals in post-lingually deafened adults fitted with bilateral cochlear implants using CIS+ processing.Ear Hear. 2008 Jan;29(1):33-44. doi: 10.1097/AUD.0b013e31815d636f. Ear Hear. 2008. PMID: 18091105
-
Similar patterns of learning and performance variability for human discrimination of interaural time differences at high and low frequencies.J Acoust Soc Am. 2007 Apr;121(4):2207-16. doi: 10.1121/1.2434758. J Acoust Soc Am. 2007. PMID: 17471734
-
Blind people are more sensitive than sighted people to binaural sound-location cues, particularly inter-aural level differences.Hear Res. 2016 Feb;332:223-232. doi: 10.1016/j.heares.2015.09.012. Epub 2015 Oct 1. Hear Res. 2016. PMID: 26433052
-
Asymmetric transfer of sound localization learning between indistinguishable interaural cues.Exp Brain Res. 2014 Jun;232(6):1707-16. doi: 10.1007/s00221-014-3863-7. Epub 2014 Feb 25. Exp Brain Res. 2014. PMID: 24566800
Cited by
-
Population coding of auditory space in the dorsal inferior colliculus persists with altered binaural cues.bioRxiv [Preprint]. 2024 Sep 13:2024.09.13.612867. doi: 10.1101/2024.09.13.612867. bioRxiv. 2024. PMID: 39314270 Free PMC article. Preprint.
-
Melodic contour identification by cochlear implant listeners.Ear Hear. 2007 Jun;28(3):302-19. doi: 10.1097/01.aud.0000261689.35445.20. Ear Hear. 2007. PMID: 17485980 Free PMC article.
-
The cost and benefit of juvenile training on adult perceptual skill.J Neurosci. 2011 Apr 6;31(14):5383-91. doi: 10.1523/JNEUROSCI.6137-10.2011. J Neurosci. 2011. PMID: 21471373 Free PMC article.
-
Perceptual learning and generalization resulting from training on an auditory amplitude-modulation detection task.J Acoust Soc Am. 2011 Feb;129(2):898-906. doi: 10.1121/1.3531841. J Acoust Soc Am. 2011. PMID: 21361447 Free PMC article.
-
Auditory Training for Central Auditory Processing Disorder.Semin Hear. 2015 Nov;36(4):199-215. doi: 10.1055/s-0035-1564458. Semin Hear. 2015. PMID: 27587909 Free PMC article.
References
-
- Rayleigh L. Philosophical Magazine. 1907;13:214–232.
-
- Fedderson W E, Sandel T T, Teas D C, Jeffress L A. J Acoust Soc Am. 1957;29:988–991.
-
- Tobias J V, Schubert E D. J Acoust Soc Am. 1959;31:1595–1605.
-
- Hafter E R, Dye R H, Gilkey R H. J Acoust Soc Am. 1979;65:471–477. - PubMed
-
- Held R. Am J Psychol. 1955;68:526–548. - PubMed
Publication types
MeSH terms
Grants and funding
LinkOut - more resources
Full Text Sources
Other Literature Sources
