

Large upward bias in estimation of locus-specific effects from genomewide scans
- PMID: 11593451
- PMCID: PMC1235546
- DOI: 10.1086/324471
Large upward bias in estimation of locus-specific effects from genomewide scans
Abstract
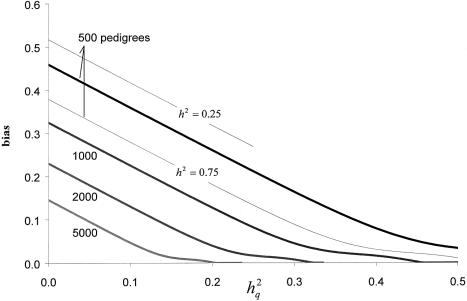
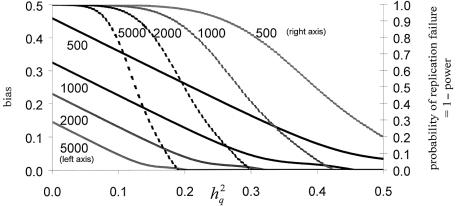
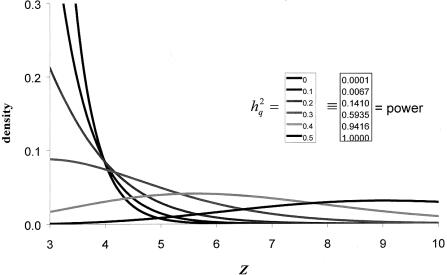
The primary goal of a genomewide scan is to estimate the genomic locations of genes influencing a trait of interest. It is sometimes said that a secondary goal is to estimate the phenotypic effects of each identified locus. Here, it is shown that these two objectives cannot be met reliably by use of a single data set of a currently realistic size. Simulation and analytical results, based on variance-components linkage analysis as an example, demonstrate that estimates of locus-specific effect size at genomewide LOD score peaks tend to be grossly inflated and can even be virtually independent of the true effect size, even for studies on large samples when the true effect size is small. However, the bias diminishes asymptotically. The explanation for the bias is that the LOD score is a function of the locus-specific effect-size estimate, such that there is a high correlation between the observed statistical significance and the effect-size estimate. When the LOD score is maximized over the many pointwise tests being conducted throughout the genome, the locus-specific effect-size estimate is therefore effectively maximized as well. We argue that attempts at bias correction give unsatisfactory results, and that pointwise estimation in an independent data set may be the only way of obtaining reliable estimates of locus-specific effect-and then only if one does not condition on statistical significance being obtained. We further show that the same factors causing this bias are responsible for frequent failures to replicate initial claims of linkage or association for complex traits, even when the initial localization is, in fact, correct. The findings of this study have wide-ranging implications, as they apply to all statistical methods of gene localization. It is hoped that, by keeping this bias in mind, we will more realistically interpret and extrapolate from the results of genomewide scans.
Figures


References
-
- Beaty TH, Liang KY (1987) Robust inference for variance components models in families ascertained through probands. I. Conditioning on the proband's phenotype. Genet Epidemiol 4:203–210 - PubMed
-
- Beavis WD (1994) The power and deceit of QTL experiments: lessons from comparative QTL studies. In: 49th annual corn and sorghum industry research conference. American Seed Trade Association, Washington, DC, pp 250–266
Publication types
MeSH terms
Grants and funding
LinkOut - more resources
Full Text Sources
Other Literature Sources
Medical
Miscellaneous
