

A humidity-sensitive Arabidopsis copine mutant exhibits precocious cell death and increased disease resistance
- PMID: 11595798
- PMCID: PMC139155
- DOI: 10.1105/tpc.010226
A humidity-sensitive Arabidopsis copine mutant exhibits precocious cell death and increased disease resistance
Abstract
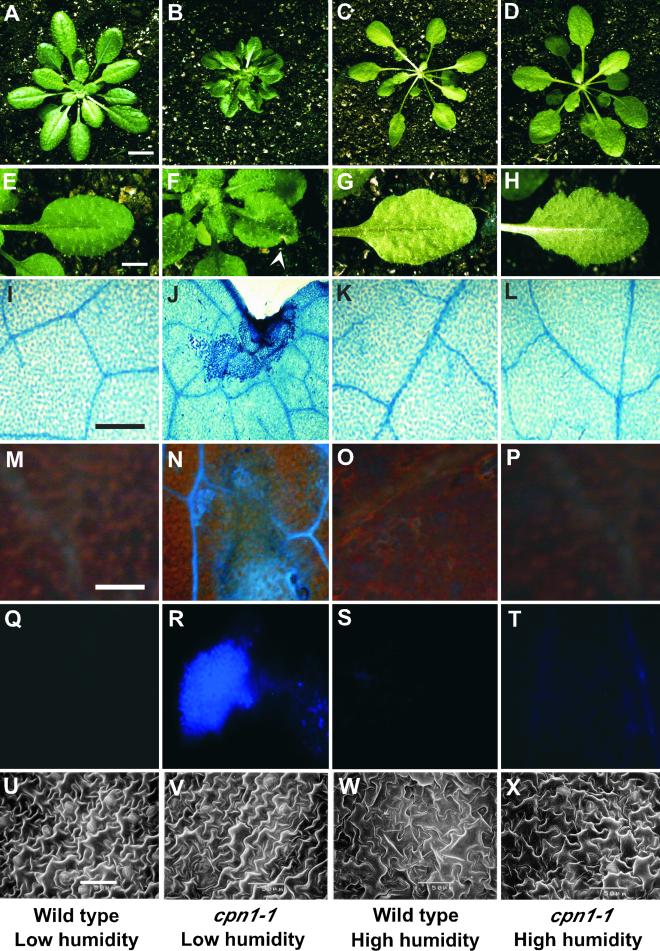
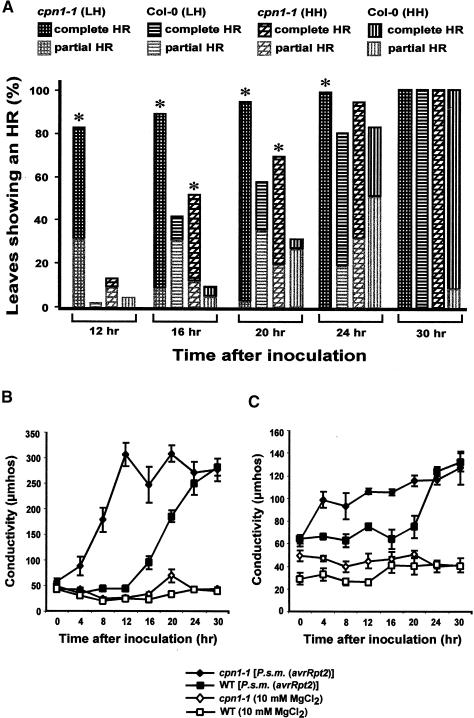
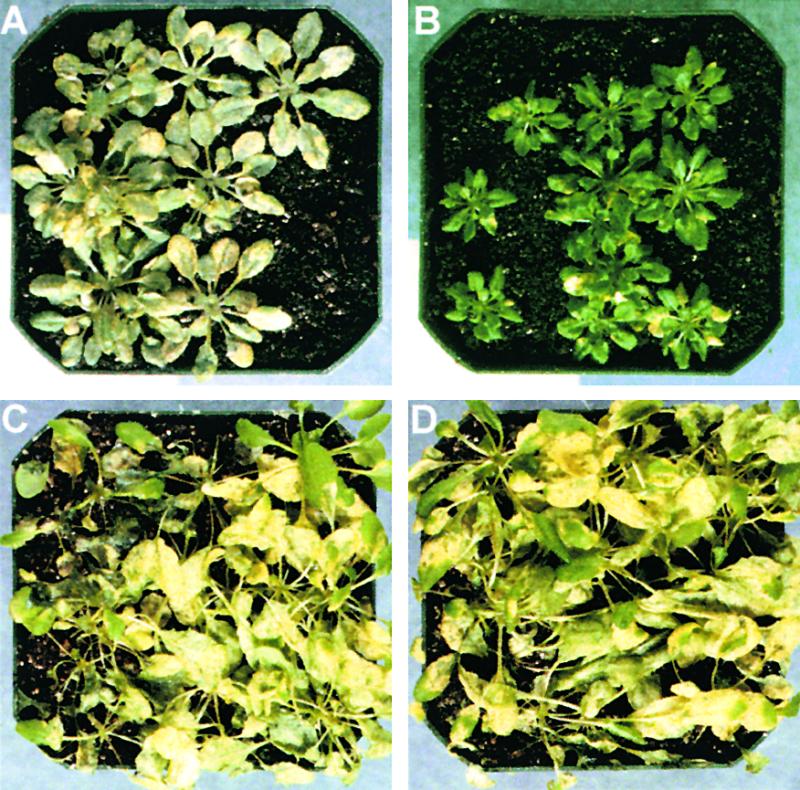
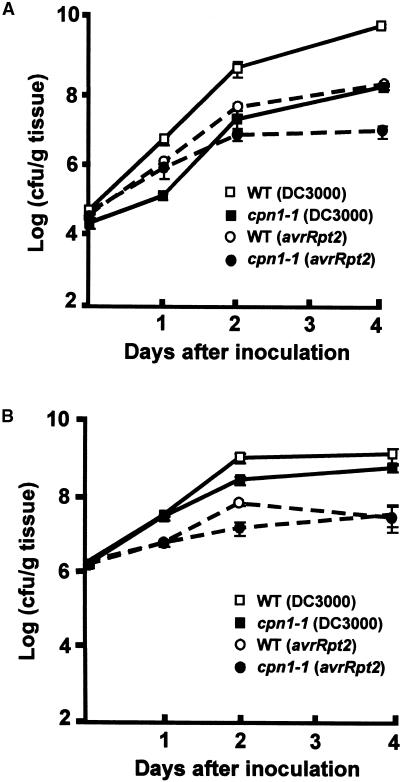
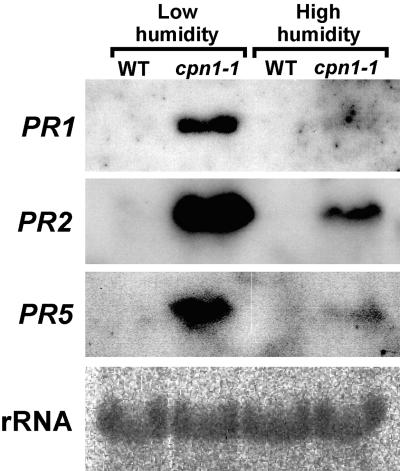
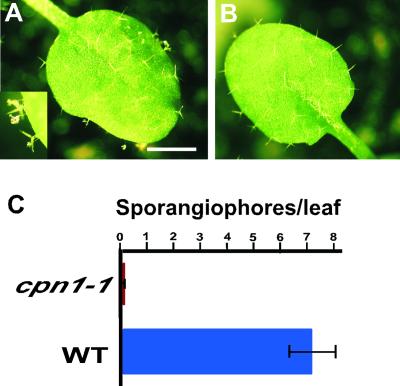
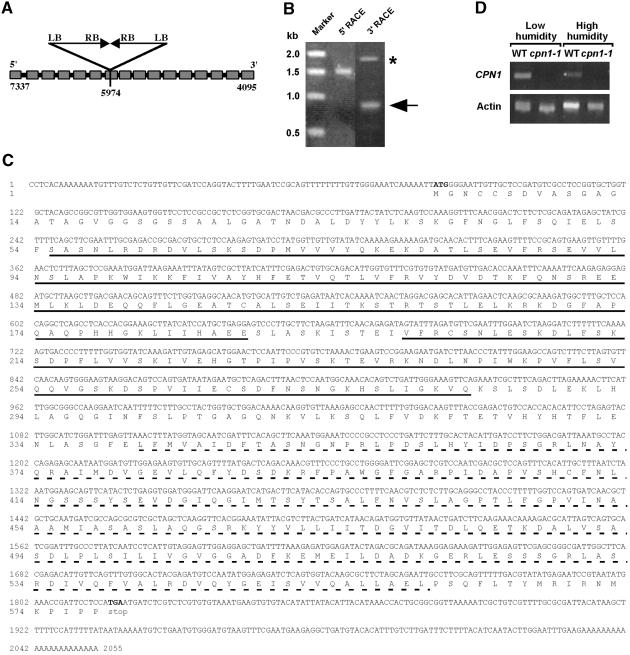
The copines are a newly identified class of calcium-dependent, phospholipid binding proteins that are present in a wide range of organisms, including Paramecium, plants, Caenorhabditis elegans, mouse, and human. However, the biological functions of the copines are unknown. Here, we describe a humidity-sensitive copine mutant in Arabidopsis. Under nonpermissive, low-humidity conditions, the cpn1-1 mutant displayed aberrant regulation of cell death that included a lesion mimic phenotype and an accelerated hypersensitive response (HR). However, the HR in cpn1-1 showed no increase in sensitivity to low pathogen titers. Low-humidity-grown cpn1-1 mutants also exhibited morphological abnormalities, increased resistance to virulent strains of Pseudomonas syringae and Peronospora parasitica, and constitutive expression of pathogenesis-related (PR) genes. Growth of cpn1-1 under permissive, high-humidity conditions abolished the increased disease resistance, lesion mimic, and morphological mutant phenotypes but only partially alleviated the accelerated HR and constitutive PR gene expression phenotypes. The disease resistance phenotype of cpn1-1 suggests that the CPN1 gene regulates defense responses. Alternatively, the primary function of CPN1 may be the regulation of plant responses to low humidity, and the effect of the cpn1-1 mutation on disease resistance may be indirect.
Figures
Similar articles
-
Regulation of Arabidopsis COPINE 1 gene expression in response to pathogens and abiotic stimuli.Plant Physiol. 2003 Jul;132(3):1370-81. doi: 10.1104/pp.103.022970. Plant Physiol. 2003. PMID: 12857819 Free PMC article.
-
Transgenic expression of the von Willebrand A domain of the BONZAI 1/COPINE 1 protein triggers a lesion-mimic phenotype in Arabidopsis.Planta. 2005 Apr;221(1):85-94. doi: 10.1007/s00425-004-1413-4. Epub 2004 Nov 18. Planta. 2005. PMID: 15843967
-
Evidence that the BONZAI1/COPINE1 protein is a calcium- and pathogen-responsive defense suppressor.Plant Mol Biol. 2009 Jan;69(1-2):155-66. doi: 10.1007/s11103-008-9413-6. Epub 2008 Oct 15. Plant Mol Biol. 2009. PMID: 18855102
-
A single amino acid insertion in the WRKY domain of the Arabidopsis TIR-NBS-LRR-WRKY-type disease resistance protein SLH1 (sensitive to low humidity 1) causes activation of defense responses and hypersensitive cell death.Plant J. 2005 Sep;43(6):873-88. doi: 10.1111/j.1365-313X.2005.02500.x. Plant J. 2005. PMID: 16146526
-
Cell death: fatal induction in plants.Curr Biol. 1997 Sep 1;7(9):R534-7. doi: 10.1016/s0960-9822(06)00274-0. Curr Biol. 1997. PMID: 9285704 Review.
Cited by
-
Mutation Types of CYP71P1 Cause Different Phenotypes of Mosaic Spot Lesion and Premature Leaf Senescence in Rice.Front Plant Sci. 2021 Mar 23;12:641300. doi: 10.3389/fpls.2021.641300. eCollection 2021. Front Plant Sci. 2021. PMID: 33833770 Free PMC article.
-
Complex regulation of an R gene SNC1 revealed by auto-immune mutants.Plant Signal Behav. 2012 Feb;7(2):213-6. doi: 10.4161/psb.18884. Epub 2012 Feb 1. Plant Signal Behav. 2012. PMID: 22415045 Free PMC article. Review.
-
Novel functions of Stomatal Cytokinesis-Defective 1 (SCD1) in innate immune responses against bacteria.J Biol Chem. 2010 Jul 23;285(30):23342-50. doi: 10.1074/jbc.M109.090787. Epub 2010 May 14. J Biol Chem. 2010. PMID: 20472560 Free PMC article.
-
Monoubiquitination of histone 2B at the disease resistance gene locus regulates its expression and impacts immune responses in Arabidopsis.Plant Physiol. 2014 May;165(1):309-18. doi: 10.1104/pp.113.227801. Epub 2014 Mar 24. Plant Physiol. 2014. PMID: 24664204 Free PMC article.
-
Characterization and mapping of complementary lesion-mimic genes lm1 and lm2 in common wheat.Theor Appl Genet. 2009 Oct;119(6):1005-12. doi: 10.1007/s00122-009-1104-4. Epub 2009 Jul 21. Theor Appl Genet. 2009. PMID: 19621213
References
-
- Azzi, A., Boscoboinik, D., and Hensey, C. (1992). The protein kinase C family. Eur. J. Biochem. 208, 547–557. - PubMed
-
- Bent, A.F., Kunkel, B.N., Dahlbeck, D., Brown, K.L., Schmidt, R., Giraudat, J., Leung, J., and Staskawicz, B.J. (1994). RPS2 of Arabidopsis thaliana: A leucine-rich repeat class of plant disease resistance genes. Science 265, 1856–1860. - PubMed
-
- Bowler, C., and Fluhr, R. (2000). The role of calcium and activated oxygens as signals for controlling cross-tolerance. Trends Plant Sci. 5, 241–246. - PubMed
MeSH terms
Substances
LinkOut - more resources
Full Text Sources
Other Literature Sources
Molecular Biology Databases
Research Materials
Miscellaneous
