. 2001;2(10):RESEARCH0041.
doi: 10.1186/gb-2001-2-10-research0041. Epub 2001 Sep 13.

Genomic-scale measurement of mRNA turnover and the mechanisms of action of the anti-cancer drug flavopiridol

Affiliations

Genomic-scale measurement of mRNA turnover and the mechanisms of action of the anti-cancer drug flavopiridol

L T Lam et al. Genome Biol. 2001.

Abstract

Background: Flavopiridol, a flavonoid currently in cancer clinical trials, inhibits cyclin-dependent kinases (CDKs) by competitively blocking their ATP-binding pocket. However, the mechanism of action of flavopiridol as an anti-cancer agent has not been fully elucidated.

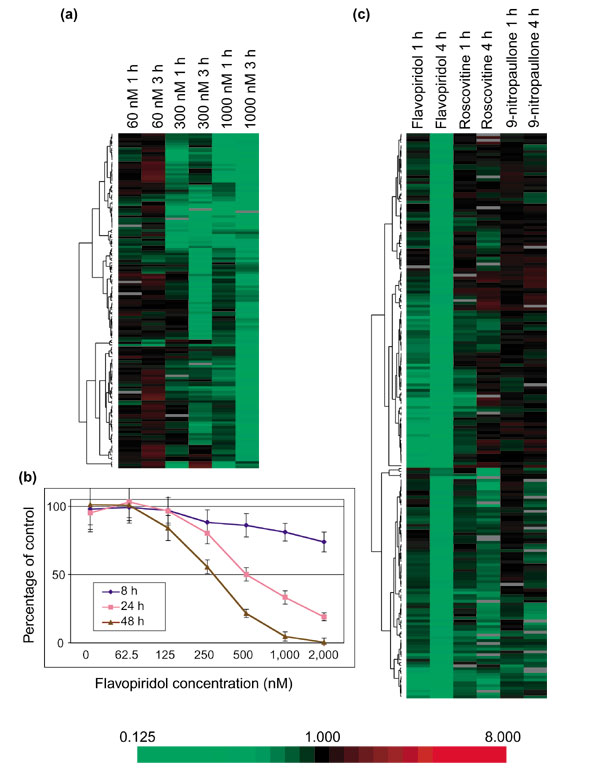
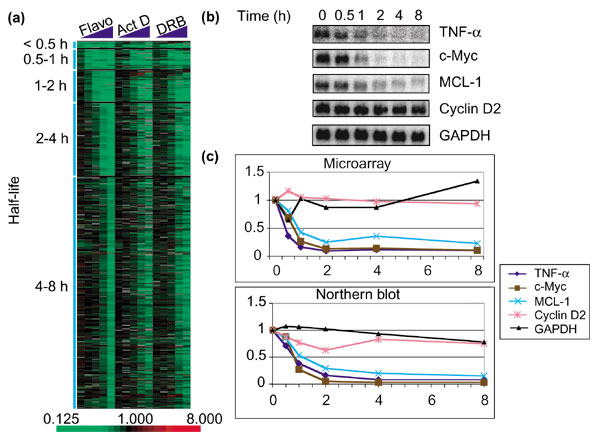
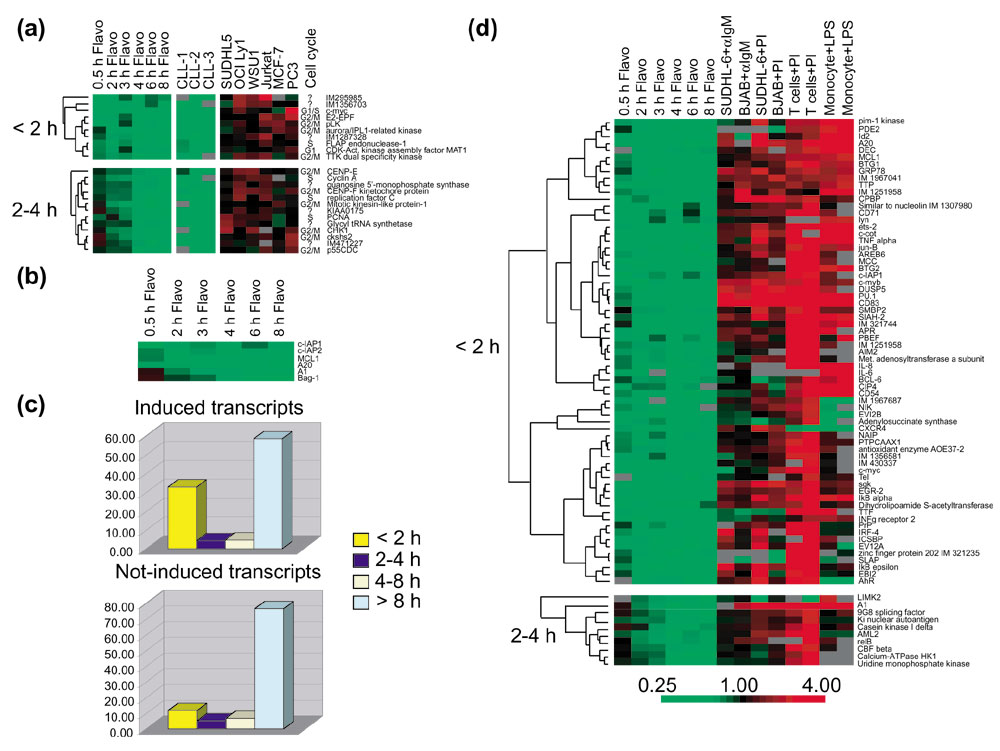
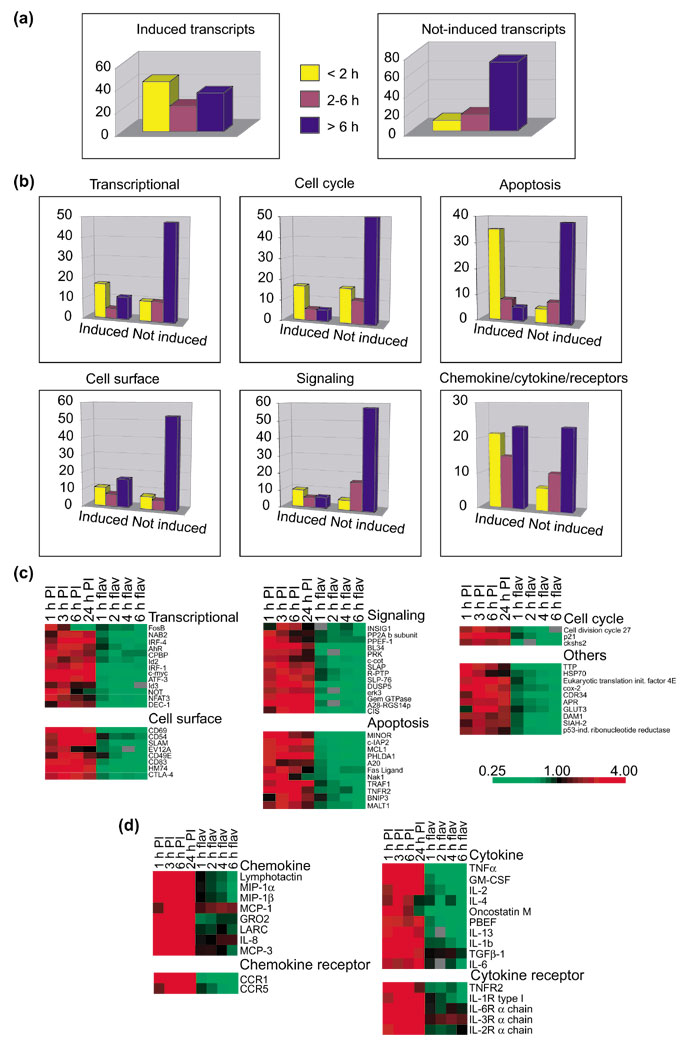
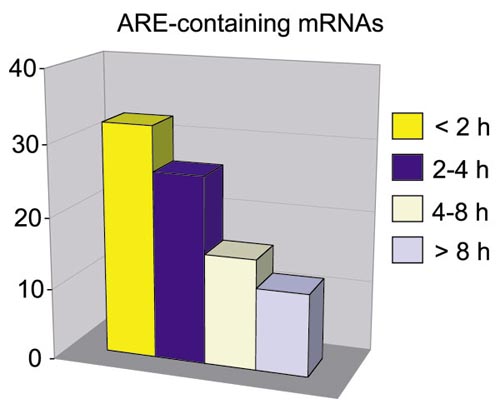
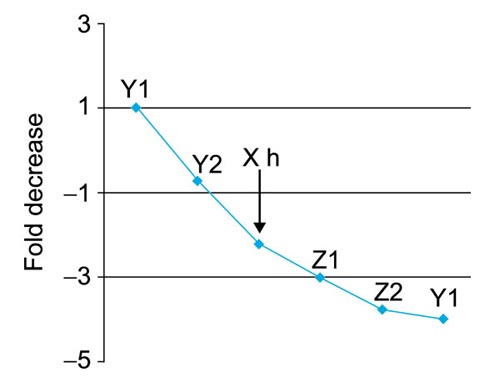
Results: Using DNA microarrays, we found that flavopiridol inhibited gene expression broadly, in contrast to two other CDK inhibitors, roscovitine and 9-nitropaullone. The gene expression profile of flavopiridol closely resembled the profiles of two transcription inhibitors, actinomycin D and 5,6-dichloro-1-beta-D-ribofuranosyl-benzimidazole (DRB), suggesting that flavopiridol inhibits transcription globally. We were therefore able to use flavopiridol to measure mRNA turnover rates comprehensively and we found that different functional classes of genes had distinct distributions of mRNA turnover rates. In particular, genes encoding apoptosis regulators frequently had very short half-lives, as did several genes encoding key cell-cycle regulators. Strikingly, genes that were transcriptionally inducible were disproportionately represented in the class of genes with rapid mRNA turnover.

Conclusions: The present genomic-scale measurement of mRNA turnover uncovered a regulatory logic that links gene function with mRNA half-life. The observation that transcriptionally inducible genes often have short mRNA half-lives demonstrates that cells have a coordinated strategy to rapidly modulate the mRNA levels of these genes. In addition, the present results suggest that flavopiridol may be more effective against types of cancer that are highly dependent on genes with unstable mRNAs.


Figures

Figure 1
Figure 1
Gene expression patterns of lymphoma cell line OCI-Ly3 treated with flavopiridol. (a) Hierarchical clustering of OCI-Ly3 cells treated with 60 nM, 300 nM, or 1 μM flavopiridol for 1 or 3 h. Each column is a single experiment comparing two cDNA populations; treated sample was labeled red (Cy5) and untreated sample was labeled green (Cy3). Each row represents data from a single cDNA microarray spot. The red-to-green (Cy5/Cy3) ratio reflects hybridization to that spot, a measure of relative gene expression; intensity reflects the magnitude of the difference between the samples according to the ratio color scale. Red indicates Cy5/Cy3 ratios >1, green indicates Cy5/Cy3 ratios < 1, black indicates no significant change in gene expression, and gray indicates the spot did not meet data selection criteria. These ratios were depicted according to the color scale shown at the bottom. (b) MTT assays. OCI-Ly3 cells were treated with increasing concentration of flavopiridol (0 to 2 μM) for 8, 24 or 48 h. MTT was added to the cells 2 h before harvesting. The plate was read at 570 nm. The result was shown as percentage of control versus flavopiridol concentration. (c) Hierarchical clustering of OCI-Ly3 cells treated with flavopiridol (1 μM), roscovitine (25 μM), or 9-nitropaullone (2.5 μM) for 1 or 4 h. These concentrations were chosen to give roughly equivalent (approximately 50%) cytotoxicity at 24 h without significant loss of cell viability at 8 h. The treated samples were labeled red (Cy5) and untreated samples were labeled green (Cy3). Only genes that were downregulated by more than threefold in one or more samples were extracted for clustering.
Figure 2
Figure 2
Similar gene expression patterns of OCI-Ly3 cells treated with flavopiridol, actinomycin D and DRB. (a) OCI-Ly3 cells were treated with flavopiridol (1 μM), actinomycin D (10 μg/ml), or DRB (100 μM) for 0.5, 1, 2, 4 and 8 h. These concentrations were chosen to give roughly equivalent (approximately 50%) cytotoxicity at 24 h without significant loss of cell viability at 8 h. The treated samples were labeled red (Cy5) and untreated samples were labeled green (Cy3). Genes were categorized according to their half-lives by the scheme as described in Materials and methods. (b) Northern blot analysis of selected genes. (c) Comparison of turnover rate of selected genes from microarray data and Northern blot analysis (percentage of control versus time).
Figure 3
Figure 3
The majority of well-measured genes on the Lymphochip decreased in mRNA abundance with first-order kinetics after transcriptional inhibition. See text for details.
Figure 4
Figure 4
Analysis of genes inhibited by flavopiridol. OCI-Ly3 cells were treated with flavopiridol (1 μM) for 0.5, 2, 3, 4, 6 or 8 h. Total RNA was prepared for microarray analysis on Lymphochips with approximately 17,000 microarray elements. The treated samples were labeled red (Cy5) and untreated samples were labeled green (Cy3). Genes were first categorized according to their half-lives using the scheme as described in the Materials and methods section. These genes were then clustered according to their function. (a) Proliferation genes with half-lives of less than 4 h. The cell-cycle phase in which the particular gene is expressed is indicated. (b) Anti-apoptotic genes with short half-lives. (c) Percentages of induced or not-induced microarray elements as categorized by their half-lives. (d) Induced genes with half-lives of less than 4 h. See text for details.
Figure 5
Figure 5
Subgrouping of induced genes of PBMCs. Purified PBMCs were induced with PI for 1, 3, 6 or 24 h before harvesting for microarray analysis. The induced samples were labeled red (Cy5) and uninduced samples were labeled green (Cy3). For analyzing the turnover rate of these induced transcripts, purified PBMCs were first induced with PI treatment for 3 h followed by flavopiridol treatment for 1, 2, 4 or 6 h before harvesting for microarray analysis. The induced samples treated with flavopiridol were labeled red (Cy5) and induced samples without flavopiridol treatment were labeled green (Cy3). (a) Percentages of genes (induced or not induced by PI) are plotted according to their half-lives (indicated by the different colors). (b) Percentages of genes of certain functional groups (induced or not induced by PI) are plotted according to their half-lives. (c) Microarray data showing highly induced genes with short half-lives of certain functional groups. (d) Microarray data showing half-lives of highly induced chemokines, cytokines and their receptors.
Figure 6
Figure 6
Percentages of AUUUA-containing transcripts in different half-life groups.
Figure 7
Figure 7
Scheme for determining half-lives in Figures 2, 4 and 5. See Materials and methods for details.

References

    1. Alizadeh AA, Eisen MB, Davis RE, Ma C, Lossos IS, Rosenwald A, Boldrick JC, Sabet H, Tran T, Yu X, et al. Distinct types of diffuse large B-cell lymphoma identified by gene expression profiling. Nature. 2000;403:503–511. - PubMed
    1. Bittner M, Meltzer P, Chen Y, Jiang Y, Seftor E, Hendrix M, Radmacher M, Simon R, Yakhini Z, Ben-Dor A, et al. Molecular classification of cutaneous malignant melanoma by gene expression profiling. Nature. 2000;406:536–540. - PubMed
    1. Perou CM, Sorlie T, Eisen MB, van de Rijn M, Jeffrey SS, Rees CA, Pollack JR, Ross DT, Johnsen H, Akslen LA, et al. Molecular portraits of human breast tumours. Nature. 2000;406:747–752. - PubMed
    1. Carlson B, Pearlstein R, Naik R, Sedlacek H, Sausville E, Worland P. Inhibition of CDK2, CDK4 and CDK7 by flavopiridol and structural analogs. Proc Am Assoc Cancer Res. 1996;37:424.
    1. De Azevedo WF, Jr, Mueller-Dieckmann HJ, Schulze-Gahmen U, Worland PJ, Sausville E, Kim SH. Structural basis for specificity and potency of a flavonoid inhibitor of human CDK2, a cell cycle kinase. Proc Natl Acad Sci USA. 1996;93:2735–2740. - PMC - PubMed

MeSH terms

LinkOut - more resources