

doi: 10.1186/gb-2001-2-10-reviews2002.
Epub 2001 Sep 27.
Having a BLAST with bioinformatics (and avoiding BLASTphemy)
Affiliations
- PMID: 11597340
- PMCID: PMC138974
- DOI: 10.1186/gb-2001-2-10-reviews2002
Item in Clipboard
Having a BLAST with bioinformatics (and avoiding BLASTphemy)
Genome Biol.
2001.
Abstract
Searching for similarities between biological sequences is the principal means by which bioinformatics contributes to our understanding of biology. Of the various informatics tools developed to accomplish this task, the most widely used is BLAST, the basic local alignment search tool. This article discusses the principles, workings, applications and potential pitfalls of BLAST, focusing on the implementation developed at the National Center for Biotechnology Information.
Figures
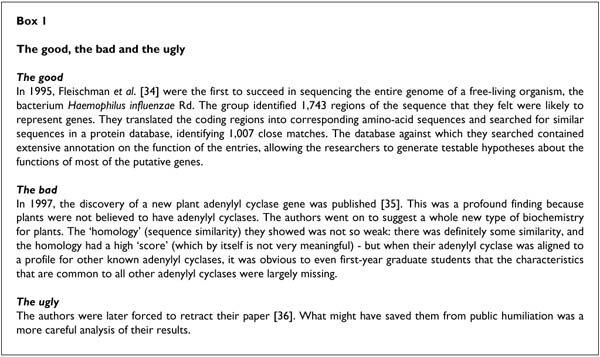
The good, the bad and the ugly
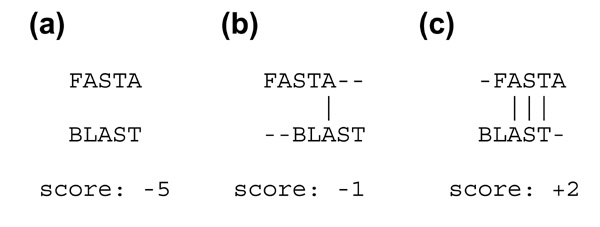
Why alignments matter and why determining the best alignment can be hard. Shown are several different alignments of two sequences, for which a mismatch is scored as -1 and a match is scored as +1. The vertical lines indicate exact matches. (a) A terrible alignment with five mismatches and no matches gives a score of -5. (b) A poor alignment with two mismatches and one match gives a score of -1. (c) The optimal alignment has one mismatch and three matches, and a score of +2.
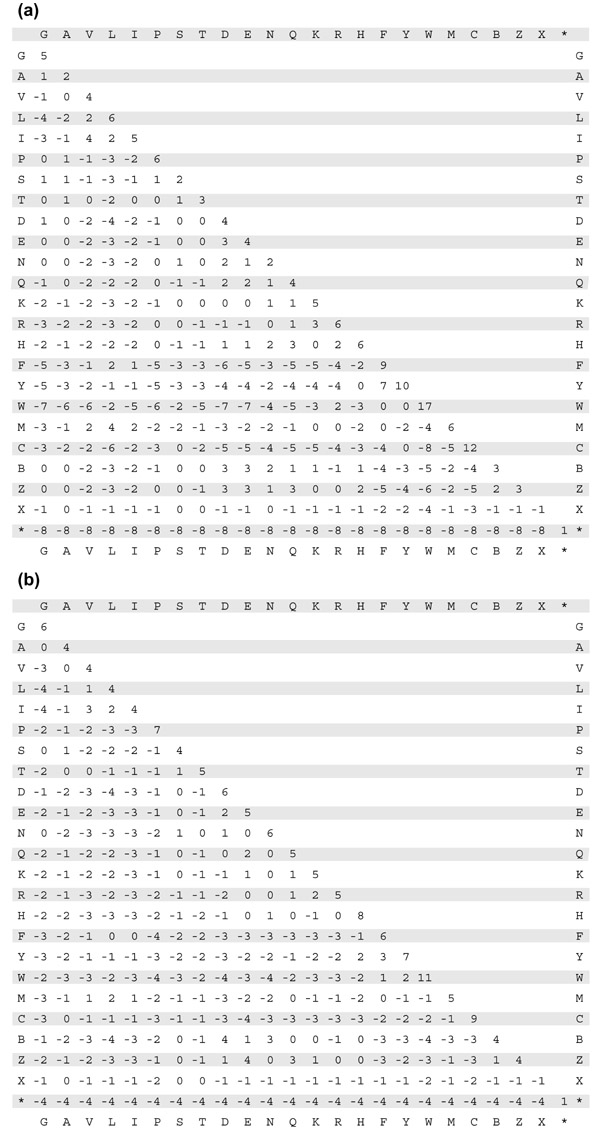
The PAM250 matrix with the amino acids grouped according to the chemistry of the side chain. The numbers indicate how to score the alignment of any given amino acid (taken from one axis) with any other amino acid (taken from the other axis). Each value in the matrix is calculated by dividing the frequency with which one amino acid is observed to be replaced by another in related proteins separated by one evolutionary step (based on phylogenetic trees) by the probability that the same two amino acids might align by chance, giving what is called the relatedness odds score. The more common the amino acids in an aligned pair, the higher the probability of a chance alignment, indicating a less significant alignment. The ratio is then converted to a logarithm (which allows the individual pair scores in an alignment to be added rather than multiplied) and expressed as what is called a log odds score. PAM matrices are usually scaled in 10 log10 units, which is roughly the same as third-bit units. (b) The BLOSUM62 matrix with the amino acids in the table grouped according to the chemistry of the side chain, as in (a). Each value in the matrix is calculated by dividing the frequency of occurrence of the amino acid pair in the BLOCKS database, clustered at the 62% level, divided by the probability that the same two amino acids might align by chance. The ratio is then converted to a logarithm and expressed as a log odds score, as for PAM. BLOSUM matrices are usually scaled in half-bit units. A score of zero indicates that the frequency with which a given two amino acids were found aligned in the database was as expected by chance, while a positive score indicates that the alignment was found more often than by chance, and a negative score indicates that the alignment was found less often than by chance.
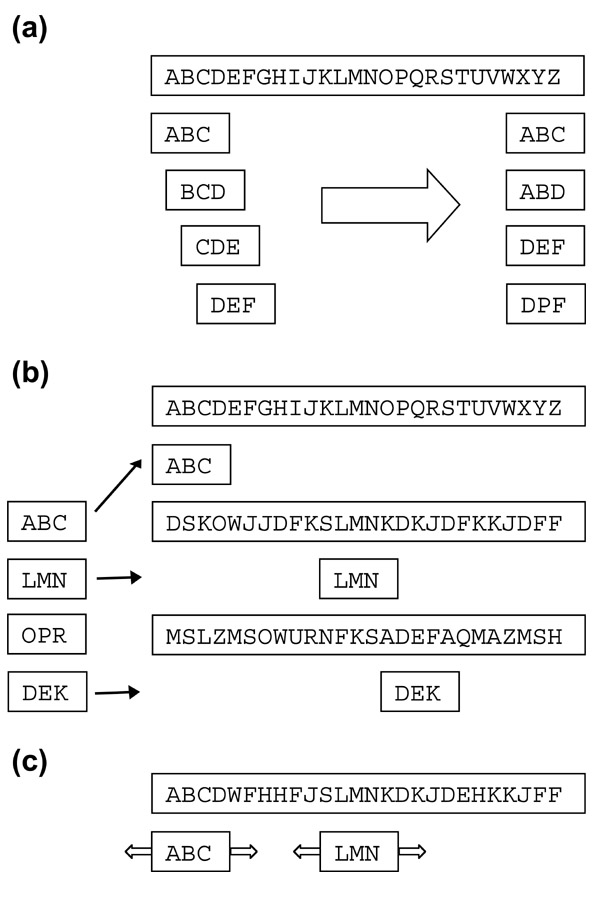
The BLAST algorithm. (a) Given a query sequence of length L, BLAST derives a list of words of length w, where w = 3 for amino-acid sequences (shown) and 11 for nucleotide sequences. There are at most L - w + 1 such words. This word list is then expanded to include all high-scoring matching words, keeping only those that score more than the neighborhood word score threshold T when scored using a scoring matrix such as PAM250 or BLOSUM62. For typical parameter values, this results in about 50 words per residue of the query sequence. (b) The high-scoring word list is compared to the sequence database and exact matches are identified. (c) For each word match, the alignment is extended in both directions to generate alignments that score higher than the score threshold S.
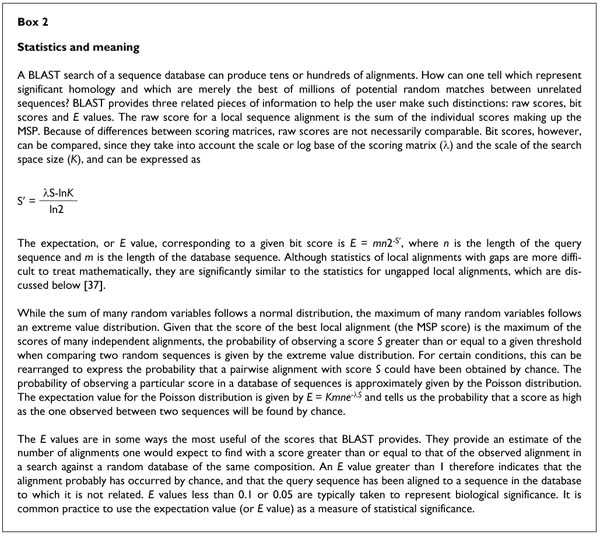
Statistics and meaning
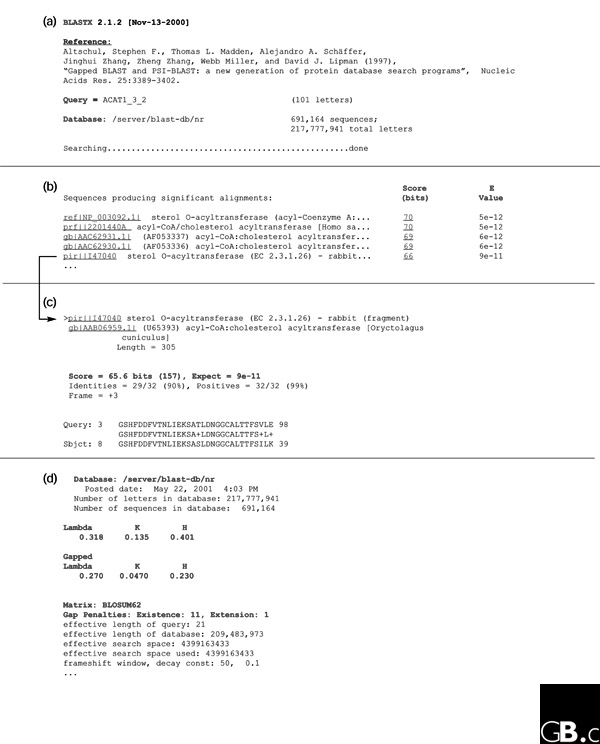
The output from a BLAST search consists of four parts. The first is the header (a), which includes the BLAST program and version used, and the name and length of both the query sequence and of the target database. In this case, the program used was BLASTX, so the query sequence was a nucleotide sequence and was translated in all six frames and compared to a protein database, nr, which is the non-redundant protein database maintained by NCBI. The second part of the output (b) is a summary of sequences producing significant alignments, along with both normalized scores and E values (see text for further details; only the four highest-scoring hits are shown). (c) The alignments (MSPs) and their properties are then shown, including the raw score, bit score, E value, and level of identity, for each high-scoring alignment (only one is shown here). (d) Finally, the output includes all of the parameters used in the search, including the scoring matrix used, the penalties used for gaps and extensions, the size of the effective search space (the product of the effective lengths of the query sequence and the database) and the statistical parameters λ and K (only a subset of the parameters are illustrated here).
References
-
- Altschul SF, Gish W, Miller W, Myers EW, Lipman DJ. Basic local alignment search tool. J Mol Biol. 1990;215:403–410. - PubMed
-
- NCBI BLASt http://www.ncbi.nlm.nih.gov/BLAST/
-
- WU-BLAST http://blast.wustl.edu/
-
- Baxevanis AD, Ouellette BFF, (eds) Bioinformatics: A Practical Guide to the Analysis of Genes and Proteins John Wiley; 1998.
-
- Durbin R, Eddy S, Krogh A, Mitchison G. Biological Sequence Analysis: Probabilistic Models of Proteins and Nucleic Acids Cambridge: Cambridge University Press; 1998.
MeSH terms
LinkOut - more resources
Full Text Sources
Other Literature Sources
Research Materials
