

Oxidative stress inhibits the repair of photodamage to the photosynthetic machinery
- PMID: 11598002
- PMCID: PMC125664
- DOI: 10.1093/emboj/20.20.5587
Oxidative stress inhibits the repair of photodamage to the photosynthetic machinery
Abstract
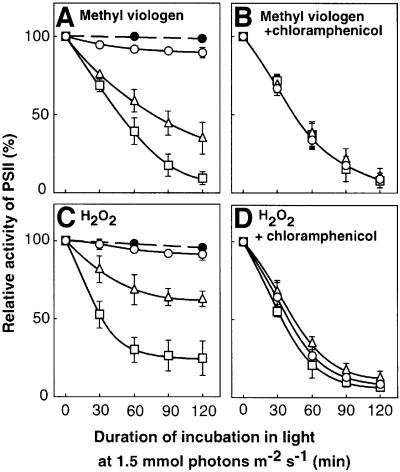
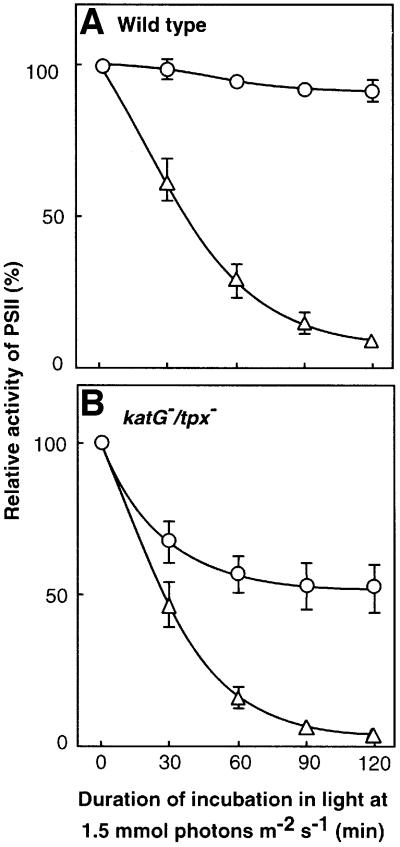
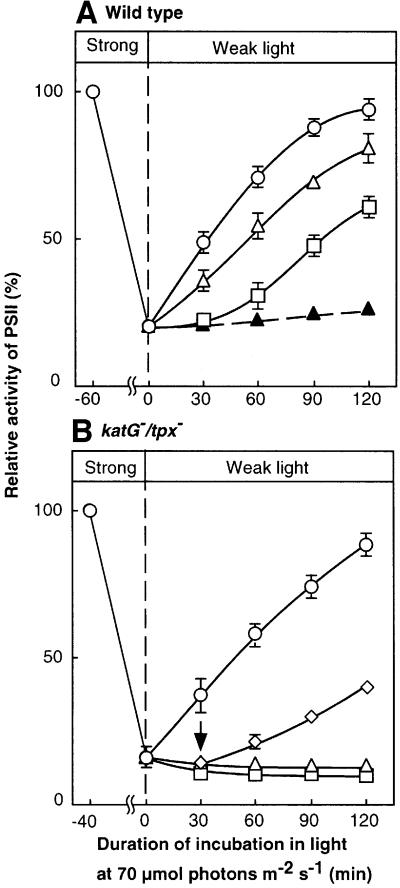
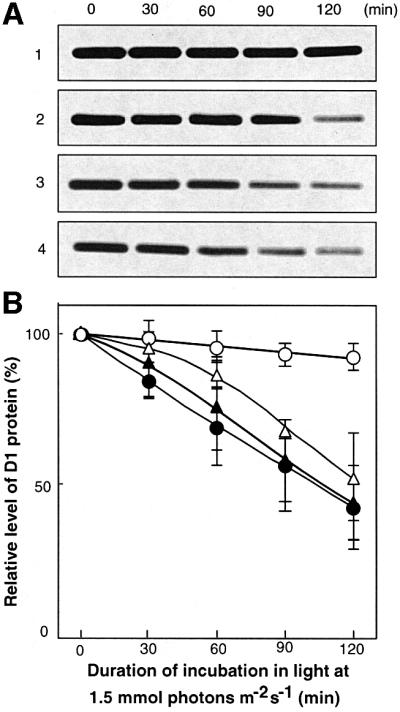
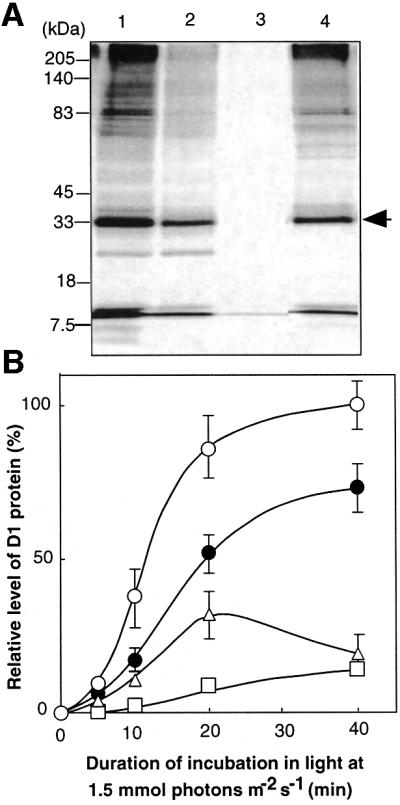
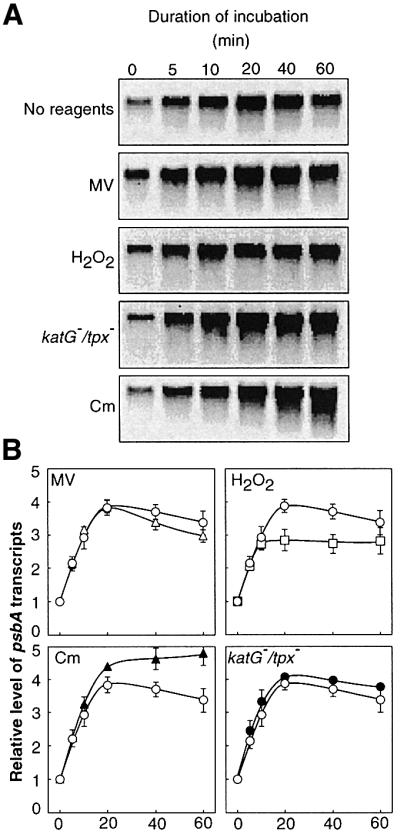
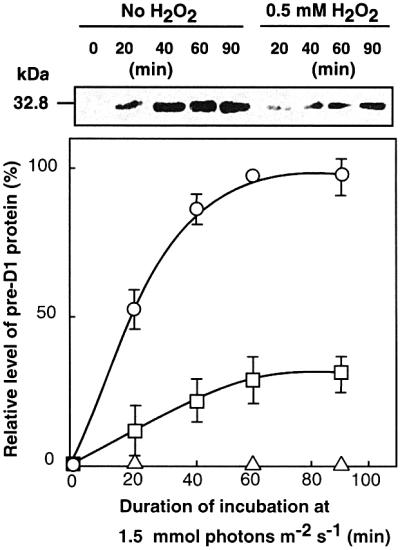
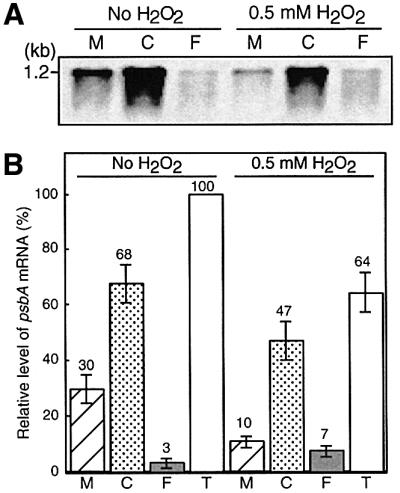
Absorption of excess light energy by the photosynthetic machinery results in the generation of reactive oxygen species (ROS), such as H2O2. We investigated the effects in vivo of ROS to clarify the nature of the damage caused by such excess light energy to the photosynthetic machinery in the cyanobacterium Synechocystis sp. PCC 6803. Treatments of cyanobacterial cells that supposedly increased intracellular concentrations of ROS apparently stimulated the photodamage to photosystem II by inhibiting the repair of the damage to photosystem II and not by accelerating the photodamage directly. This conclusion was confirmed by the effects of the mutation of genes for H2O2-scavenging enzymes on the recovery of photosystem II. Pulse labeling experiments revealed that ROS inhibited the synthesis of proteins de novo. In particular, ROS inhibited synthesis of the D1 protein, a component of the reaction center of photosystem II. Northern and western blot analyses suggested that ROS might influence the outcome of photodamage primarily via inhibition of translation of the psbA gene, which encodes the precursor to D1 protein.
Figures
Similar articles
-
Singlet oxygen inhibits the repair of photosystem II by suppressing the translation elongation of the D1 protein in Synechocystis sp. PCC 6803.Biochemistry. 2004 Sep 7;43(35):11321-30. doi: 10.1021/bi036178q. Biochemistry. 2004. PMID: 15366942
-
Salt stress inhibits the repair of photodamaged photosystem II by suppressing the transcription and translation of psbA genes in synechocystis.Plant Physiol. 2002 Nov;130(3):1443-53. doi: 10.1104/pp.011114. Plant Physiol. 2002. PMID: 12428009 Free PMC article.
-
Environmental stress inhibits the synthesis de novo of proteins involved in the photodamage-repair cycle of Photosystem II in Synechocystis sp. PCC 6803.Biochim Biophys Acta. 2004 Jun 28;1657(1):23-32. doi: 10.1016/j.bbabio.2004.03.003. Biochim Biophys Acta. 2004. PMID: 15238209
-
A new paradigm for the action of reactive oxygen species in the photoinhibition of photosystem II.Biochim Biophys Acta. 2006 Jul;1757(7):742-9. doi: 10.1016/j.bbabio.2006.05.013. Epub 2006 May 23. Biochim Biophys Acta. 2006. PMID: 16784721 Review.
-
Revised scheme for the mechanism of photoinhibition and its application to enhance the abiotic stress tolerance of the photosynthetic machinery.Appl Microbiol Biotechnol. 2014 Nov;98(21):8777-96. doi: 10.1007/s00253-014-6020-0. Epub 2014 Aug 21. Appl Microbiol Biotechnol. 2014. PMID: 25139449 Review.
Cited by
-
Comparative analysis of photosynthetic and respiratory parameters in the psychrophilic unicellular green alga Koliella antarctica, cultured in indoor and outdoor photo-bioreactors.Physiol Mol Biol Plants. 2018 Nov;24(6):1139-1146. doi: 10.1007/s12298-018-0595-3. Epub 2018 Aug 18. Physiol Mol Biol Plants. 2018. PMID: 30425430 Free PMC article.
-
Inhibition of the repair of photosystem II by oxidative stress in cyanobacteria.Photosynth Res. 2005 Jun;84(1-3):1-7. doi: 10.1007/s11120-004-6434-0. Photosynth Res. 2005. PMID: 16049747 Review.
-
Rice phot1a mutation reduces plant growth by affecting photosynthetic responses to light during early seedling growth.Plant Mol Biol. 2009 Mar;69(5):605-19. doi: 10.1007/s11103-008-9442-1. Epub 2008 Dec 17. Plant Mol Biol. 2009. PMID: 19089317
-
Moderate Photoinhibition of Photosystem II Significantly Affects Linear Electron Flow in the Shade-Demanding Plant Panax notoginseng.Front Plant Sci. 2018 May 15;9:637. doi: 10.3389/fpls.2018.00637. eCollection 2018. Front Plant Sci. 2018. PMID: 29868090 Free PMC article.
-
A theoretical framework of the hybrid mechanism of photosystem II photodamage.Photosynth Res. 2021 Aug;149(1-2):107-120. doi: 10.1007/s11120-021-00843-1. Epub 2021 Aug 2. Photosynth Res. 2021. PMID: 34338941
References
-
- Ananyev G., Wydrzynski,T., Renger,G. and Klimov,V. (1992) Transient peroxide formation by the manganese-containing, redox-active donor side of photosystem II upon inhibition of O2 evolution with lauroylcholine chloride. Biochim. Biophys. Acta, 1100, 303–311.
-
- Andersson B. and Barber,J. (1996) Mechanisms of photodamage and protein degradation during photoinhibition of photosystem II. In Baker,N.R. (ed.), Photosynthesis and the Environment. Kluwer Academic Publishers, Dordrecht, The Netherlands, pp. 101–121.
-
- Arnon D.I., McSwain,B.D, Tsujimoto,H.Y. and Wada,K. (1974) Photochemical activity and components of membrane preparations from blue-green algae. I. Coexistence of two photosystems in relation to chlorophyll a and removal of phycocyanin. Biochim. Biophys. Acta, 357, 231–245. - PubMed
-
- Aro E.-M., Virgin,I. and Andersson,B. (1993) Photoinhibition of photosystem II. Inactivation, protein damage and turnover. Biochim. Biophys. Acta, 1143, 113–134. - PubMed
-
- Asada K. (1996) Radical production and scavenging in the chloroplasts. In Baker,N.R. (ed.), Photosynthesis and the Environment. Kluwer Academic Publishers, Dordrecht, The Netherlands, pp. 123–150.
Publication types
MeSH terms
Substances
LinkOut - more resources
Full Text Sources
Molecular Biology Databases
