

Calcium signalling through nucleotide receptor P2X1 in rat portal vein myocytes
- PMID: 11600670
- PMCID: PMC2278886
- DOI: 10.1111/j.1469-7793.2001.0339c.xd
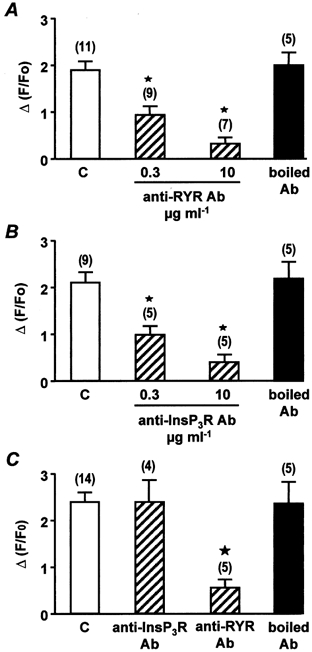
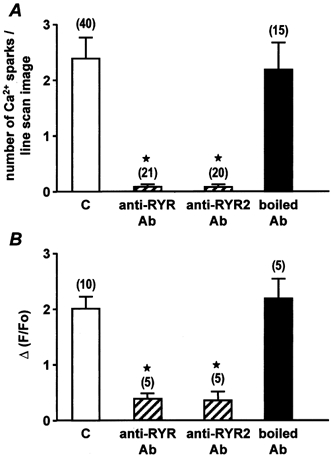
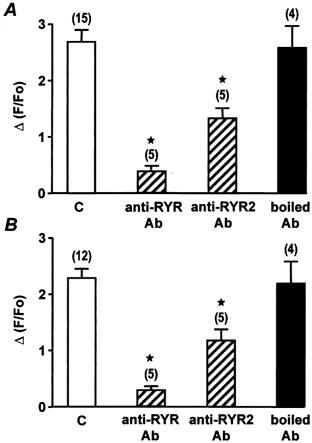
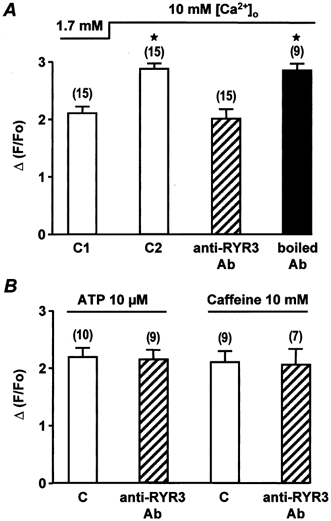
Calcium signalling through nucleotide receptor P2X1 in rat portal vein myocytes
Abstract
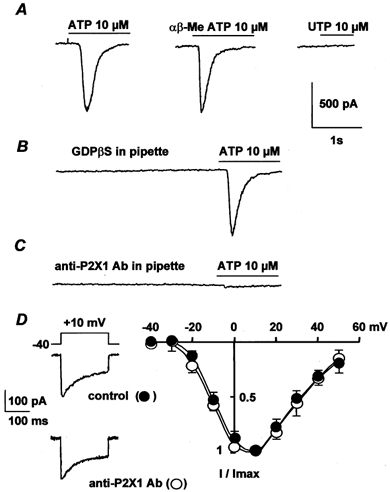
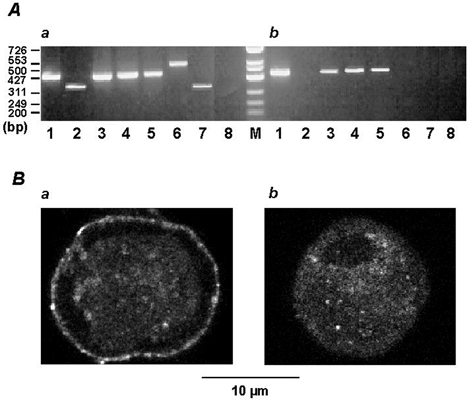
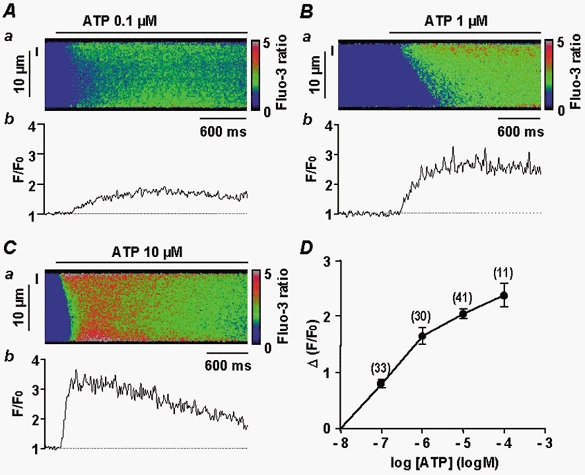
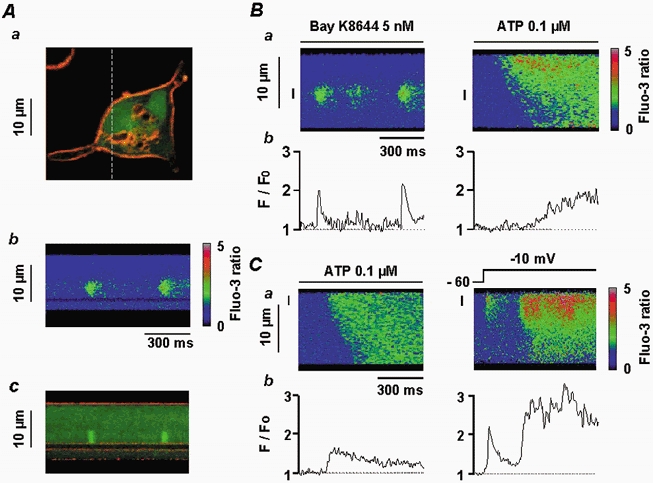
1. ATP-mediated Ca2+ signalling was studied in freshly isolated rat portal vein myocytes by means of a laser confocal microscope and the patch-clamp technique. 2. In vascular myocytes held at -60 mV, ATP induced a large inward current that was supported mainly by activation of P2X1 receptors, although other P2X receptor subtypes (P2X3, P2X4 and P2X5) were revealed by reverse transcription-polymerase chain reaction. 3. Confocal Ca2+ measurements revealed that ATP-mediated Ca2+ responses started at initiation sites where spontaneous or triggered Ca2+ sparks were not detected, whereas membrane depolarizations triggered Ca2+ waves by repetitive activation of Ca2+ sparks from a single initiation site. 4. ATP-mediated Ca2+ responses depended on Ca2+ influx through non-selective cation channels that activated, in turn, Ca2+ release from the intracellular store via ryanodine receptors (RYRs). Using specific antibodies directed against the RYR subtypes, we show that ATP-mediated Ca2+ release requires, at least, RYR2, but not RYR3. 5. Our results suggest that, in vascular myocytes, Ca2+ influx through P2X1 receptors may trigger Ca2+-induced Ca2+ release at intracellular sites where RYRs are not clustered.
Figures
Similar articles
-
Lack of run-down of smooth muscle P2X receptor currents recorded with the amphotericin permeabilized patch technique, physiological and pharmacological characterization of the properties of mesenteric artery P2X receptor ion channels.Br J Pharmacol. 2000 Dec;131(8):1659-66. doi: 10.1038/sj.bjp.0703744. Br J Pharmacol. 2000. PMID: 11139444 Free PMC article.
-
Ca2+ entry following P2X receptor activation induces IP3 receptor-mediated Ca2+ release in myocytes from small renal arteries.Br J Pharmacol. 2011 Apr;162(7):1618-38. doi: 10.1111/j.1476-5381.2010.01169.x. Br J Pharmacol. 2011. PMID: 21175582 Free PMC article.
-
Purinergic activation of spontaneous transient outward currents in guinea pig taenia colonic myocytes.Am J Physiol Cell Physiol. 2000 Feb;278(2):C352-62. doi: 10.1152/ajpcell.2000.278.2.C352. Am J Physiol Cell Physiol. 2000. PMID: 10666031
-
Ca2+ sparks and Ca2+ waves activate different Ca(2+)-dependent ion channels in single myocytes from rat portal vein.Cell Calcium. 1996 Aug;20(2):153-60. doi: 10.1016/s0143-4160(96)90104-9. Cell Calcium. 1996. PMID: 8889206 Review.
-
Calcium handling by vascular myocytes in hypertension.Braz J Med Biol Res. 1997 Mar;30(3):315-23. doi: 10.1590/s0100-879x1997000300004. Braz J Med Biol Res. 1997. PMID: 9246229 Review.
Cited by
-
Purinergic signalling in the liver in health and disease.Purinergic Signal. 2014 Mar;10(1):51-70. doi: 10.1007/s11302-013-9398-8. Epub 2013 Nov 24. Purinergic Signal. 2014. PMID: 24271096 Free PMC article. Review.
-
The role of purinergic signaling in the liver and in transplantation: effects of extracellular nucleotides on hepatic graft vascular injury, rejection and metabolism.Front Biosci. 2008 Jan 1;13:2588-603. doi: 10.2741/2868. Front Biosci. 2008. PMID: 17981736 Free PMC article. Review.
-
Intermittent ATP release from nerve terminals elicits focal smooth muscle Ca2+ transients in mouse vas deferens.J Physiol. 2002 Jun 15;541(Pt 3):849-62. doi: 10.1113/jphysiol.2002.019612. J Physiol. 2002. PMID: 12068045 Free PMC article.
-
Coupling switch of P2Y-IP3 receptors mediates differential Ca(2+) signaling in human embryonic stem cells and derived cardiovascular progenitor cells.Purinergic Signal. 2016 Sep;12(3):465-78. doi: 10.1007/s11302-016-9512-9. Epub 2016 Apr 20. Purinergic Signal. 2016. PMID: 27098757 Free PMC article.
-
The decrease of expression of ryanodine receptor sub-type 2 is reversed by gentamycin sulphate in vascular myocytes from mdx mice.J Cell Mol Med. 2009 Sep;13(9B):3122-30. doi: 10.1111/j.1582-4934.2009.00718.x. Epub 2009 Feb 11. J Cell Mol Med. 2009. PMID: 19298530 Free PMC article.
References
-
- Arnaudeau S, Boittin FX, Macrez N, Lavie JL, Mironneau C, Mironneau J. L-type and Ca2+ release channel-dependent hierarchical Ca2+ signalling in rat portal vein myocytes. Cell Calcium. 1997;22:399–411. - PubMed
-
- Arnaudeau S, Macrez-Lepretre N, Mironneau J. Activation of calcium sparks by angiotensin II in vascular myocytes. Biochemical and Biophysical Research Communications. 1996;222:809–815. - PubMed
-
- Benham CD, Tsien RW. A novel receptor-operated Ca2+-permeable channel activated by ATP in smooth muscle. Nature. 1987;328:275–278. - PubMed
-
- Boarder MR, Hourani SM. The regulation of vascular function by P2 receptors: multiple sites and multiple receptors. Trends in Pharmacological Sciences. 1998;19:99–107. - PubMed
-
- Boittin FX, Macrez N, Halet G, Mironneau J. Norepinephrine-induced Ca2+ waves depend on InsP3 and ryanodine receptor activation in vascular myocytes. American Journal of Physiology. 1999;277:C139–151. - PubMed
Publication types
MeSH terms
Substances
LinkOut - more resources
Full Text Sources
Molecular Biology Databases
Miscellaneous