. 2001 Oct 15;536(Pt 2):361-73.
doi: 10.1111/j.1469-7793.2001.0361c.xd.

Attenuation of G protein-mediated inhibition of N-type calcium currents by expression of caveolins in mammalian NG108-15 cells

Affiliations

Attenuation of G protein-mediated inhibition of N-type calcium currents by expression of caveolins in mammalian NG108-15 cells

M Toselli et al. J Physiol. .

Abstract

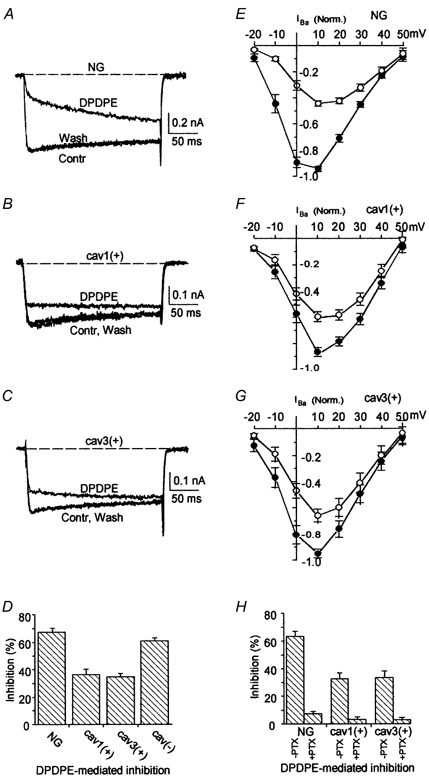
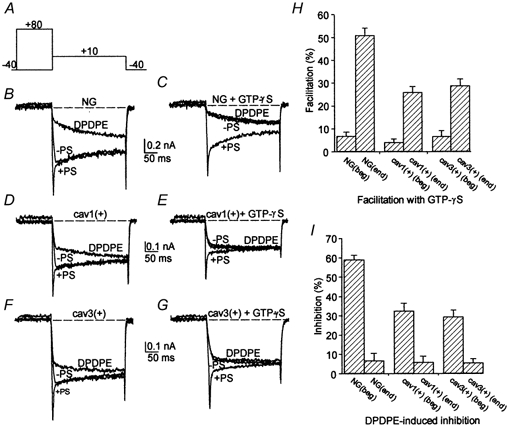
1. Caveolins are integral proteins of glycolipid/cholesterol-rich plasmalemmal caveolae domains, where, they may function as a plasma membrane scaffold onto which many classes of signalling molecules, including receptors and heterotrimeric G proteins, can assemble. To ascertain whether caveolins influence G protein-mediated signal transduction, we stably expressed caveolin-1 and -3 isoforms in the neuroblastoma x glioma NG108-15 hybrid cell line, lacking endogenous caveolins. Subsequently, using whole-cell voltage clamp methods, we examined whether the modulation of N-type voltage-gated Ca2+ channels by G(o) protein-coupled, delta-type opioid receptors might be affected by recombinant caveolin expression. 2. In transfected NG108-15 cells, caveolins localized at the plasma membrane and, upon subcellular fractionation on sucrose density gradients, they co-localized in Triton-resistant, low buoyancy fractions, with endogenous G(o) protein alpha-subunits. 3. The voltage-dependent inhibition of omega-conotoxin GVIA-sensitive Ba2+ currents following either activation of delta-opioid receptors by the agonist [o-pen2,o-pen5]-enkephalin (DPDPE), or direct stimulation of G proteins with guanosine 5'-O-(thiotriphosphate) (GTPgammaS) was significantly attenuated in caveolin-expressing cells. The kinetics of Ca2+ channel inhibition were also modified by caveolins. 4. Overall, these results suggest that caveolins may negatively affect G protein-dependent regulation of voltage-gated N-type Ca2+ channels, presumably by causing a reduction of the available pool of activated G proteins.


Figures

Figure 1
Figure 1. Expression of recombinant caveolin in NG108–15 cells
A, expression of caveolin-1 and −3 in stably transfected NG108–15 clones. Antibiotic-resistant clones transfected with caveolin-1 (cav1(+)), caveolin-3 (cav3(+)), or the empty pCB7 vector (cav(-)), and untransfected NG108–15 cells (NG) were individually analysed by 12.5 % SDS-PAGE and Western immunoblotting. B, recombinant caveolin-1 and −3 are targeted to the plasma membrane in transfected NG108–15 cells. Undifferentiated cav1(+) and cav3(+) cells, and differentiated cav1(+) cells were stained with caveolin-1-, or −3-specific antibodies, and visualized by indirect immunofluorescence. C, recombinant caveolin-1 and −3 partition in detergent-insoluble low-buoyancy membrane fractions. Undifferentiated cav1(+) and cav3(+) cells, and differentiated cav1(+) cells, were extracted in 1 % Triton X-100 at 4 °C and subjected to ultracentrifugation on flotation sucrose density gradients, as reported (Li et al. 1995). Equal amounts of proteins from each fraction (approximately 5 μg) were separated by SDS-PAGE and analysed by Western blotting. A negative control with untransfected cells is also shown (contr). D and E, whole-cell content and membrane partitioning of endogenous Goα-subunits are not affected by recombinant caveolin-1 expression. The content of Goα was determined by Western immunoblotting of whole extracts (D) or gradient fractions (E) of cav(-) and cav1(+) cells.
Figure 2
Figure 2. N-type Ca2+ channel currents in untransfected and in recombinant caveolin-1- and −3-expressing NG108–15 cells
A, representative Ba2+ current profiles obtained from a normal NG108–15 cell (upper tracings), a cav1(+) cell (middle tracings), and a cav3(+) cell (lower tracings). Steps of 370 ms duration were applied to increasing test potentials (−20 to +20 mV) from a holding potential of −40 mV. Cells were bathed in control saline. B, voltage dependence of N-type Ca2+ channel conductance (normalized) for untransfected NG108–15 cells (filled circles, n = 15), and cav1(+) (filled triangles, n = 19) and cav3(+) clones (open triangles, n = 11). The conductance of the N-type current was estimated according to the relation g =IBa/(V − VBa), where IBa refers to peak current values and VBa is the extrapolated reversal potential (+60 mV). The continuous line through data points is the least-squares best fit of the Boltzmann equation: gnorm = 1/{1 + exp((V+V1/2)/k)} where V1/2 and k values for the three different clones (NG, cav1(+) and cav3(+)) were 3.7, 2.3 and 4.1 mV, and −5.2, −5.5 and −5.9 mV, respectively. C, average Ba2+ current inactivation (h(3s)) vs. membrane potential for untransfected NG108–15 cells (filled circles, n = 3), and cav1(+) (filled triangles, n = 4) and cav3(+) clones (open triangles, n = 2). Currents were elicited to +10 mV after a 3 s prepulse to the potentials indicated (−100 to −40 mV). The continuous lines through data points are the least-squares best fits of the Boltzmann equation: h = 1/{1 +exp((V+V1/2)/k)} where V1/2 and k values for the three different clones (NG, cav1(+) and cav3(+)) were 13.5, 13.8 and 12.3 mV and 29.2, 33.6 and 30.3 mV, respectively.
Figure 3
Figure 3. DPDPE-induced inhibition of N-type Ba2+ current
A–C, superimposed current traces were elicited by a voltage step from −40 to +10 mV from an untransfected NG108–15 cell (A), a cav1(+) (B), and a cav3(+) cell (C) during focal perfusion with control saline (Contr), 100 nm DPDPE (DPDPE), and following washout with control saline (Wash). D, mean percentages of DPDPE-induced Ba2+ current inhibition in NG108–15 (n = 37), cav1(+) (n = 26), cav3(+) (n = 47), and cav(-) (n = 29) cells. E–G, normalized mean current- voltage relationship of Ba2+ currents before (filled symbols) and during application of 100 nm DPDPE (open symbols) from normal NG108–15 cells (n = 16) (E); cav1(+) cells (n = 19) (F) and cav3(+) cells (n = 8) (G). H, mean percentages of DPDPE-induced Ba2+ current inhibition in control NG108–15, cav1(+), and cav3(+) cells, including those unresponsive to DPDPE, and in cells pre-incubated for 24 h with 50 ng ml−1 PTX (+PTX) or not pre-incubated (-PTX).
Figure 4
Figure 4. N-type Ca2+ channel current facilitation in control NG108–15 cells and in caveolin-expressing cells
A–C, superimposed current traces were elicited by applying the protocol shown in D to cells (NG108–15, A; cav1(+), B; cav3(+), C) either bathed with control saline (Contr) or perfused with DPDPE (DPDPE), either starting directly from the holding potential of −40 mV (-PS) or following a conditioning pulse to +80 mV (+PS). E, mean percentage of DPDPE-dependent inhibition (open columns, labelled DPDPE) and of current facilitation (hatched columns) in the presence of agonist (DPDPE+PS) and in control saline (CONTR+PS), in control cells (NG, n = 16), in cav1(+) cells (n = 15), and in cav3(+) cells (n = 11). This definition of facilitation differs from the measure used in other studies of Ca2+ channel modulation: the extent of facilitation of the agonist-modified current was evaluated by subtracting the amplitude of the Ba2+ current elicited at +10 mV without pre-pulse from that following the pre-pulse (both of them obtained during application of DPDPE), and by dividing that difference by the amplitude of the current elicited at +10 mV following the prepulse in control saline. The extent of facilitation in control saline was evaluated by subtracting the amplitude of the Ba2+ current elicited at +10 mV without pre-pulse from that following the pre-pulse, and by dividing that difference by the amplitude of the current following the pre-pulse.
Figure 5
Figure 5. Decay of prepulse facilitation during repolarization in NG108–15 cells and in caveolin-1-expressing cells
A, protocol used to elicit currents shown in B and C. B and C, superimposed Ba2+ currents elicited by applying the protocol shown in A during application of 100 nm DPDPE in a control NG108–15 cell (B) and in a cav1(+) cell (C). D, percentage of current facilitation as a function of the duration of the repolarizing pulse for control NG108–15 cells (filled circles, n = 6) and for cav1(+)-expressing cells (open circles, n = 8). The fraction of reinhibited current for each repolarization interval was estimated by dividing the DPDPE-modified currents obtained at +10 mV following repolarization to −40 mV by that obtained following directly the prepulse to +80 mV without repolarization; current amplitudes were measured about 20 ms after the onset of the second test pulse. The continuous lines in D are the best fits of data points to single exponential functions.
Figure 6
Figure 6. Voltage and time dependence of current deinhibition in NG108–15 cells and in caveolin-1-expressing cells
A, protocol used to elicit currents shown in B and C. B and C, superimposed Ba2+ currents during cell perfusion with 100 nm DPDPE in a control NG108–15 cell (B), and in a cav1(+) cell (C). D, voltage dependence of current deinhibition as a function of prepulse amplitude for control NG108–15 cells (filled circles, n = 8) and for cav1(+) cells (open circles, n = 7). The continuous lines are the fit of data points to the equation: 62 + 38/(1 + exp((VV1/2)/k)} for caveolin-1-expressing cells (V1/2 = 14.1 mV; k =−8.3 mV) and to the equation: 36 + 64/(1 + exp((VV1/2)/k)} for NG108–15 cells (V1/2 = 13.6 mV; k =−7.1 mV). E, protocol used to elicit currents shown in F and G. F and G, superimposed Ba2+ currents elicited by applying the protocol shown in E during cell perfusion with 100 nm DPDPE in a cav1(+) cell (F) and in a control NG108–15 cell (G). H, time course of current deinhibition as a function of prepulse duration for control NG108–15 cells (filled circles, n = 4) and for cav1(+) cells (open circles, n = 4). The continuous lines are the fit of data points to the equation: 99 − 42exp(−t/8.8) for cav1(+) cells, and to the equation: 99 − 66exp(−t/8.1) for NG108–15 cells.
Figure 7
Figure 7. N-type Ca2+ channel current inhibition and facilitation during intracellular dialysis with GTPγS in NG108–15 cells and in caveolin-1- and −3-expressing cells
A, protocol used for the study of facilitation. B and C, superimposed current traces were obtained on step depolarization to +10 mV from a NG108–15 cell bathed in control saline, at the beginning of cell dialysis with GTPγS (B), and after about 10 min of dialysis with GTPγS (C), either starting directly from the holding potential of −40 mV (-PS) or following a conditioning pulse to +80 mV (+PS). The current traces elicited by step depolarization from −40 to +10 mV during application of DPDPE are also shown (traces labelled DPDPE). D and E, superimposed current traces were elicited in a cav1(+) cell by applying the same protocol shown in A, at the beginning of cell dialysis with GTPγS (D), and after about 10 min of dialysis with GTPγS (E). F and G, superimposed current traces were elicited in a cav3(+) cell by applying the same protocol shown in A, at the beginning of cell dialysis with GTPγS (F), and after about 10 min of dialysis with GTPγS (G). H, mean percentage of current facilitation (defined in Fig. 4) in untransfected NG108–15 cells (NG, n = 23) and in cav1(+) (n = 21), or cav3(+) (n = 19) cells, at the beginning of cell dialysis with GTPγS (beg), and after prolonged dialysis with GTPγS (end). I, mean percentage of DPDPE-induced Ba2+ current inhibition in untransfected NG108–15 cells, and in cav1(+) or cav3(+) cells (same as in H), at the beginning and after prolonged cell dialysis with GTPγS.

Similar articles

Cited by

References

    1. Anderson RGW. The caveolae membrane system. Annual Review of Biochemistry. 1998;67:199–225. - PubMed
    1. Bean BP. Neurotransmitter inhibition of neuronal calcium currents by changes in channel voltage dependence. Nature. 1989;340:153–156. - PubMed
    1. Brody DL, Patil PG, Mulle JG, Snutch TP, Yue DT. Bursts of action potential waveforms relieve G-protein inhibition of recombinant P/Q-type Ca2+ channels in HEK 293 cells. Journal of Physiology. 1997;499:637–644. - PMC - PubMed
    1. Delmas P, Brown DA, Dayrell M, Abogadie FC, Caulfield MP, Buckley NJ. On the role of endogenous G-protein βγ subunits in N-type Ca2+ current inhibition by neurotransmitters in rat sympathetic neurons. Journal of Physiology. 1998;506:319–329. - PMC - PubMed
    1. De Waard M, Liu H, Walker D, Scott VE, Gurnett CA, Campbell KP. Direct binding of G-protein βγ complex to voltage-dependent calcium channels. Nature. 1997;385:446–450. - PubMed

Publication types

MeSH terms

LinkOut - more resources