. 2001 Oct 15;29(20):4166-78.
doi: 10.1093/nar/29.20.4166.

UP element-dependent transcription at the Escherichia coli rrnB P1 promoter: positional requirements and role of the RNA polymerase alpha subunit linker

Affiliations

UP element-dependent transcription at the Escherichia coli rrnB P1 promoter: positional requirements and role of the RNA polymerase alpha subunit linker

W Meng et al. Nucleic Acids Res. .

Abstract

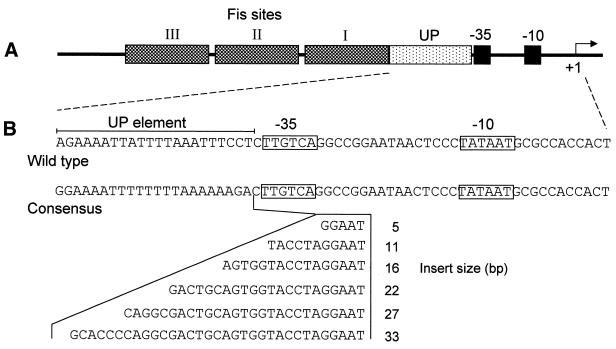
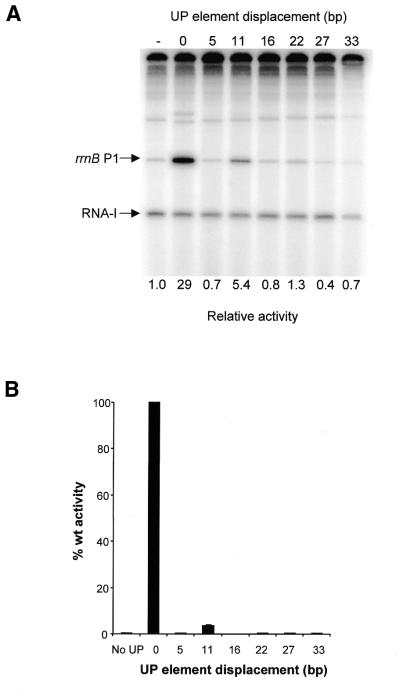
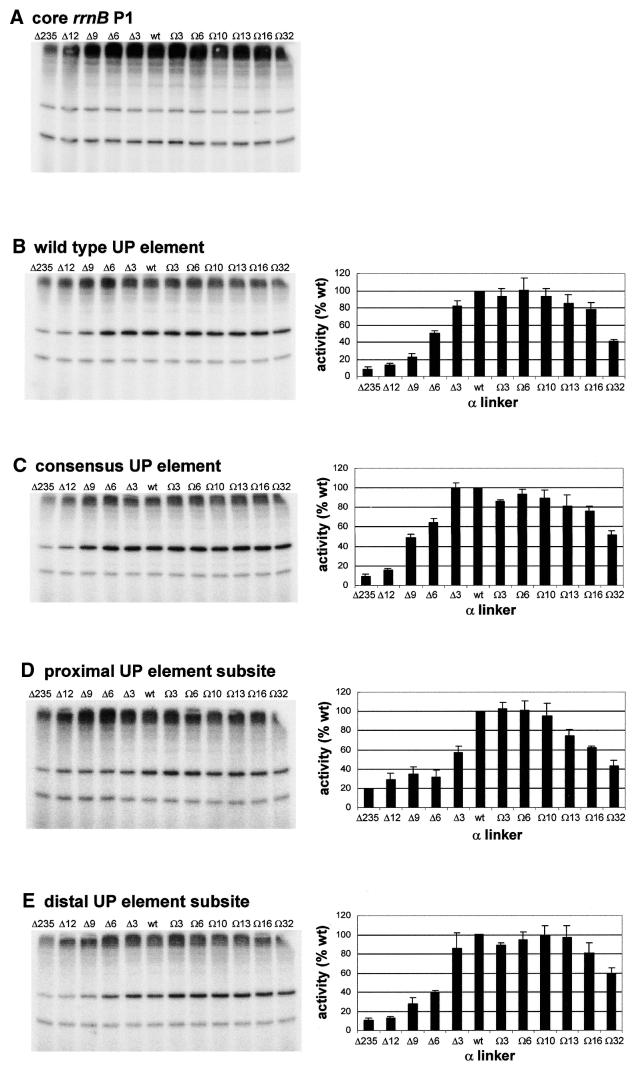
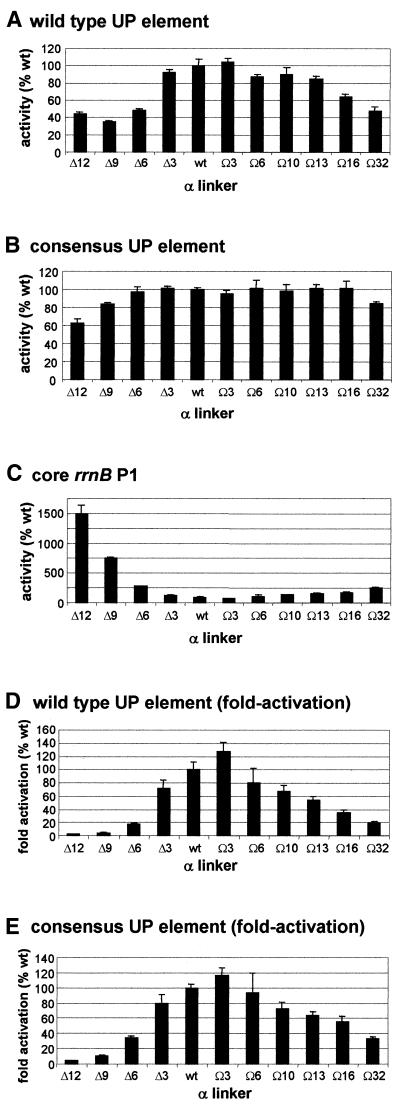
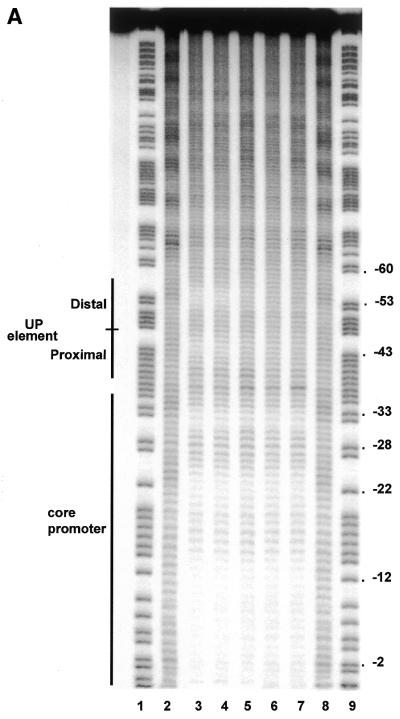
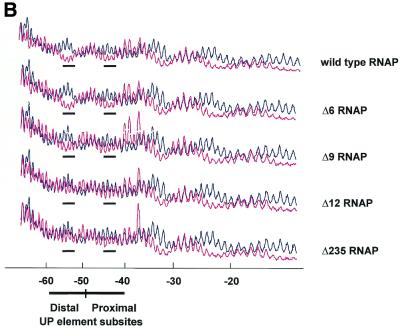
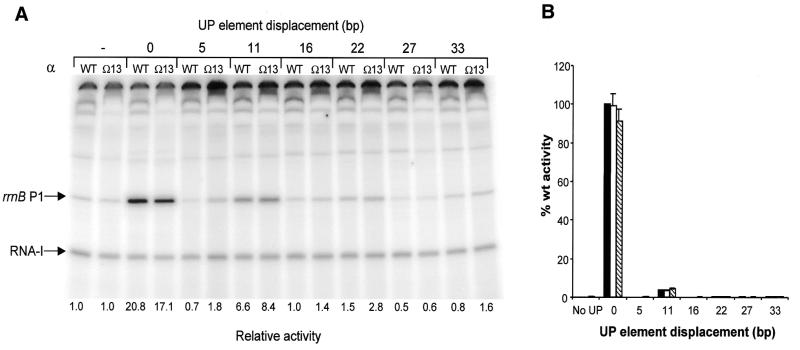
The UP element stimulates transcription from the rrnB P1 promoter through a direct interaction with the C-terminal domain of the RNA polymerase alpha subunit (alphaCTD). We investigated the effect on transcription from rrnB P1 of varying both the location of the UP element and the length of the alpha subunit interdomain linker, separately and in combination. Displacement of the UP element by a single turn of the DNA helix resulted in a large decrease in transcription from rrnB P1, while displacement by half a turn or two turns totally abolished UP element-dependent transcription. Deletions of six or more amino acids from within the alpha subunit linker resulted in a decrease in UP element-dependent stimulation, which correlated with decreased binding of alphaCTD to the UP element. Increasing the alpha linker length was less deleterious to RNA polymerase function at rrnB P1 but did not compensate for the decrease in activation that resulted from displacing the UP element. Our results suggest that the location of the UP element at rrnB P1 is crucial to its function and that the natural length of the alpha subunit linker is optimal for utilisation of the UP element at this promoter.


Figures

Figure 1
Figure 1
Displacement of the consensus UP element upstream of the rrnB P1 core region. (A) Organisation of the rrnB P1 promoter region. The rrnB P1 core region constitutes the DNA sequence from –37 to +1 with respect to the transcription initiation site (indicated with a bent arrow). Located immediately upstream of this region is the UP element (–38 to –59) and three tandem Fis sites. (B) DNA sequences from –59 to +3 of the wild type rrnB P1 promoter and of an rrnB P1 derivative containing the consensus UP element present in pRLG4713 and RLG4721. The –35 and –10 regions are boxed and the extent of the UP element sequence is indicated by a horizontal bar. DNA sequences inserted between positions –37 and –38 to displace the consensus UP element are indicated. In promoter derivatives where the UP element has been displaced by 5–22 bp these sequences comprise part or all of the SUB sequence (17), whereas derivatives in which this element has been displaced by 27 and 33 bp contain, in addition, sequences from –37 to –47 of the lac P1 promoter, which do not possess inherent UP element-like activity (13).
Figure 2
Figure 2
Effect of UP element displacement on transcription from rrnB P1 in vitro and in vivo. (A) Transcription gel showing the results of multiple round in vitro transcription reactions carried out with native RNAP on templates containing the rrnB P1 core promoter (pRLG4210) (denoted by a ‘–’ sign), and the rrnB P1 promoter in which the consensus UP element is located at the normal position (pRLG4713) (indicated by a ‘0’), or displaced upstream by the indicated number of base pairs (pRLG4714–pRLG4720). The position of the transcripts derived from the vector-derived RNA-I promoter and the rrnB P1 promoter are indicated. Promoter activities, as determined from the transcript abundance in at least four transcription assays of the type shown, are presented below each gel lane as fold change in promoter activity relative to the core rrnB P1 promoter, where core promoter activity is assigned a value of 1.0. Values of less than unity arise through inhibition of core promoter activity. Standard deviations are within 18% of the mean and are omitted for clarity. (B) Effect of UP element displacement on transcription from rrnB P1 in vivo. β-Galactosidase activities were measured in lysogens of NK5031 harbouring a single copy lacZ fusion to the rrnB P1 core promoter (RLG3097) (denoted ‘No UP’) or the rrnB P1 promoter containing a consensus UP element located at the normal position (RLG4721) (indicated by a ‘0’), or displaced upstream of the normal location by the indicated number of base pairs (RLG4722–RLG4727). Values are expressed as a percentage of the activity in RLG4721 (100%) and are the means (with standard deviation) of three or more independent assays. 100% activity = 5780 Miller units.
Figure 3
Figure 3
Effect of α subunit linker length on transcription in vitro from rrnB P1 promoter derivatives. The left hand side of each panel shows the result of a typical transcription experiment assaying the activity of RNAPs reconstituted with wild type α or one of the mutant α subunits containing longer or shorter linkers, as indicated, at the core rrnB P1 promoter (A), and at rrnB P1 containing the wild type UP element (B), the consensus full UP element (C), the consensus proximal UP element subsite (D) and the consensus distal UP element subsite (E). RNAPs were used at a concentration which gave equivalent transcription from the rrnB P1 core promoter and were: Δ235α RNAP, 27.8 nM; Δ12α RNAP, 15.2 nM; Δ9α RNAP, 18.2 nM; Δ6α RNAP, 16.8 nM; Δ3α RNAP, 10.8 nM; wild type α RNAP, 8 nM; Ω3α RNAP, 12.6 nM; Ω6α RNAP, 12.2 nM; Ω10α RNAP, 19.6 nM; Ω13α RNAP, 14.6 nM; Ω16α RNAP, 19.8 nM; Ω32α RNAP, 27.0 nM. Transcripts arising from the rrnB P1 and RNA-I promoters are indicated by arrows. On the right of each transcription gel (B–E only) the relative abundance of the transcript originating from the corresponding rrnB P1 promoter derivative in the presence of each RNAP is shown (by definition, the relative abundance of transcripts originating from the rrnB P1 core promoter in the presence of each RNAP would be 100%). The values were calculated from at least three independent experiments and are presented as a percentage (with standard deviations) of transcript obtained with wild type RNAP.
Figure 4
Figure 4
Effect of α subunit linker length on transcription in vivo from rrnB P1 promoter derivatives. β-Galactosidase activities were measured in lysogens of NK5031 harbouring a single copy lacZ fusion to (A) the rrnB P1 promoter with its natural UP element (RLG3074), (B) the rrnB P1 promoter with the consensus UP element (RLG4192) or (C) the rrnB P1 core promoter (RLG2263), in each case transformed with pMGM12, expressing wild type rpoA, or one of the pMGM12 derivatives expressing mutant rpoA alleles (pMGM13, pMGM16–pMGM22, pMGM32 or pMGM35), as indicated. For each rrnB P1 derivative, values are expressed as a percentage of the promoter activity in the presence of RNAP containing only wild type α, and are the means (with standard deviation) of three or more independent assays. 100% activity = 11.4, 1865 and 4983 Miller units, respectively, for the pMGM12 transformants of RLG2263 (core rrnB P1 promoter), RLG3074 (wild type rrnB P1 promoter) and RLG4192 (consensus rrnB P1 promoter). Fold activation due to the wild type (D) and consensus (E) UP elements in the presence of each mutant RNAP derivative is presented as a percentage of the fold activation in the presence of wild type RNAP (100%). Values were calculated by expressing the ratios of the wild type (or consensus) rrnB P1 promoter activity to the core rrnB P1 promoter activity for each RNAP derivative as a percentage of the ratio obtained in the presence of only wild type RNAP.
Figure 5
Figure 5
Hydroxyl radical cleavage of the wild type rrnB P1 promoter with wild type and mutant RNAPs. (A) Autoradiogram of a typical footprinting gel showing sites within the template (bottom) strand of the wild type rrnB P1 promoter which are protected from hydroxyl radicals by bound RNAP reconstituted with wild type or mutant α subunits. Lanes 1 and 9, Maxam–Gilbert G+A reaction; lanes 2 and 8, no RNAP; lane 3, wild type RNAP; lane 4, Δ6 RNAP; lane 5, Δ9 RNAP; lane 6, Δ12 RNAP; lane 7, Δ235 RNAP. Sequences comprising the core promoter element (as far downstream as +2) and the UP element subsites are indicated by black bars. (B) Scan of the footprinting pattern for each RNAP, reconstituted with the indicated α subunit (magenta trace), aligned in each case with the scan obtained in the absence of RNAP (black trace). The scans are averaged from three independent footprinting experiments. The regions in each scan corresponding to positions around –43 and –53 are underscored by a black bar.
Figure 5
Figure 5
Hydroxyl radical cleavage of the wild type rrnB P1 promoter with wild type and mutant RNAPs. (A) Autoradiogram of a typical footprinting gel showing sites within the template (bottom) strand of the wild type rrnB P1 promoter which are protected from hydroxyl radicals by bound RNAP reconstituted with wild type or mutant α subunits. Lanes 1 and 9, Maxam–Gilbert G+A reaction; lanes 2 and 8, no RNAP; lane 3, wild type RNAP; lane 4, Δ6 RNAP; lane 5, Δ9 RNAP; lane 6, Δ12 RNAP; lane 7, Δ235 RNAP. Sequences comprising the core promoter element (as far downstream as +2) and the UP element subsites are indicated by black bars. (B) Scan of the footprinting pattern for each RNAP, reconstituted with the indicated α subunit (magenta trace), aligned in each case with the scan obtained in the absence of RNAP (black trace). The scans are averaged from three independent footprinting experiments. The regions in each scan corresponding to positions around –43 and –53 are underscored by a black bar.
Figure 6
Figure 6
Effect of extended α subunit linker length on in vitro and in vivo RNAP activity at rrnB P1 promoters containing a displaced UP element. (A) Transcription gel showing the results of multiple round in vitro transcription reactions performed with RNAP reconstituted with wild type (WT) or Ω13 α subunits on templates containing the rrnB P1 core promoter (pRLG4210) (indicated by a ‘–’ sign), and the rrnB P1 promoter in which the consensus UP element is located at the normal position (pRLG4713) (denoted by a ‘0’), or displaced by the indicated number of base pairs (pRLG4714–pRLG4720). The position of the transcripts derived from the RNA-I and rrnB P1 promoters are indicated. Promoter activities, as determined from the transcript abundance in at least four in vitro transcription reactions of the type shown, are presented below each gel lane as fold change in promoter activity relative to the rrnB P1 core promoter, where the core promoter activity is assigned a value of 1.0 for each RNAP tested. Values of less than unity arise through inhibition of core promoter activity. Standard deviations were within 22% of the mean and are omitted for clarity. (B) Effect of extended α subunit linker length on in vivo RNAP activity at rrnB P1 promoters containing a displaced UP element. β-Galactosidase activities were measured in lysogens of NK5031 harbouring a single copy lacZ fusion to the rrnB P1 core promoter (RLG3097) (indicated with a ‘–’ sign) or the rrnB P1 promoter containing a consensus UP element located at the normal position (RLG4721) (denoted by a ‘0’), or displaced upstream of the normal location by the indicated number of base pairs (RLG4722–RLG4727). Each lysogen contained pLAW2, expressing wild type rpoA (black bars), or a pLAW2 derivative encoding the Ω6 α subunit (pMGM19; white bars) or the Ω13 α subunit (pMGM21; hatched bars). Values are expressed as a percentage of the activity in the RLG4721/pLAW2 transformant (100%) and are the means (with standard deviation) of three or more independent assays. 100% activity = 4897 Miller units.

Similar articles

Cited by

References

    1. Zhang G., Campbell,E.A., Minakhin,L., Richter,C., Severinov,K. and Darst,S.A. (1999) Crystal structure of Thermus aquaticus core RNA polymerase at 3.3 Å resolution. Cell, 98, 811–824. - PubMed
    1. Ebright R.H. (2000) RNA polymerase: structural similarities between bacterial RNA polymerase and eucaryotic RNA polymerase II. J. Mol. Biol., 304, 687–698. - PubMed
    1. Mulligan M.E., Hawley,D.K., Entriken,R. and McClure,W.R. (1984) Escherichia coli promoter sequences predict in vitro RNA polymerase selectivity. Nucleic Acids Res., 12, 789–800. - PMC - PubMed
    1. Darst S.A., Roberts,J.W., Malhotra,A., Mark,M., Severinov,K. and Severinova,E. (1997) Pribnow box recognition and melting by Escherichia coli RNA polymerase. In Eckstein,F. and Lilley,D.M.J. (eds), Nucleic Acids and Molecular Biology, Vol. 11. Springer-Verlag, Berlin, pp. 27–40.
    1. Barne K.A., Bown,J.A., Busby,S.J.W. and Minchin,S.D. (1997) Region 2.5 of the Escherichia coli RNA polymerase σ70 subunit is responsible for the recognition of the ‘extended –10’ motif at promoters. EMBO J., 16, 4034–4040. - PMC - PubMed

Publication types

MeSH terms

Substances