. 2001 Oct;108(8):1123-31.
doi: 10.1172/JCI11098.

Retinoic acid prevents experimental Cushing syndrome

Affiliations

Retinoic acid prevents experimental Cushing syndrome

M Páez-Pereda et al. J Clin Invest. 2001 Oct.

Abstract

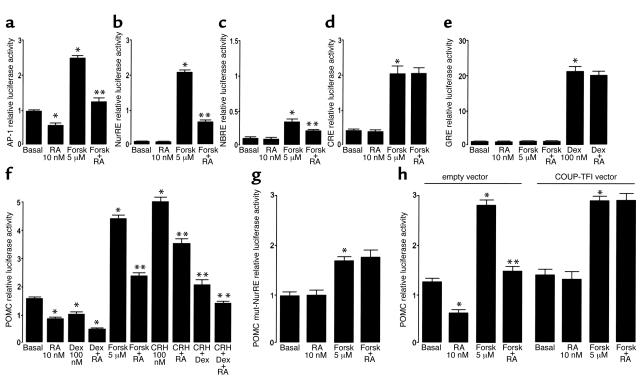
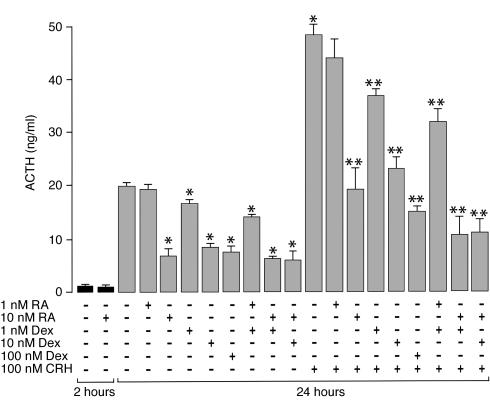
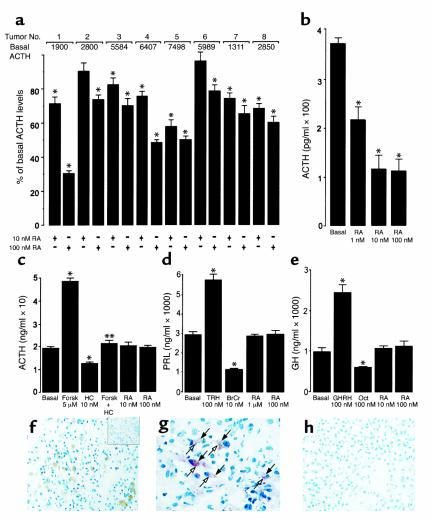
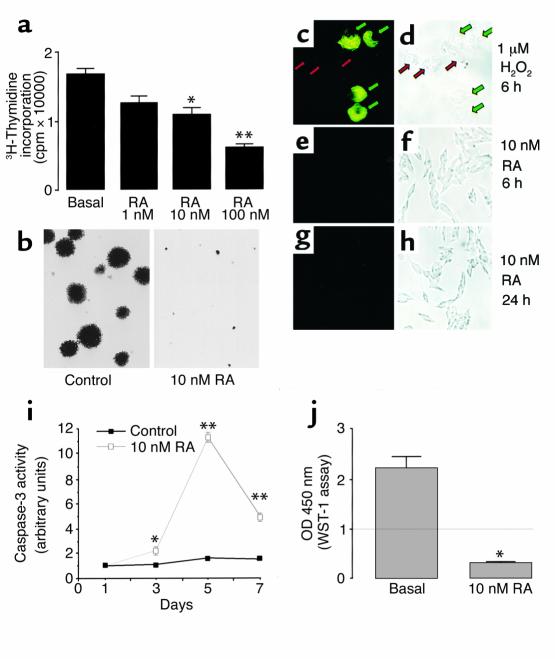
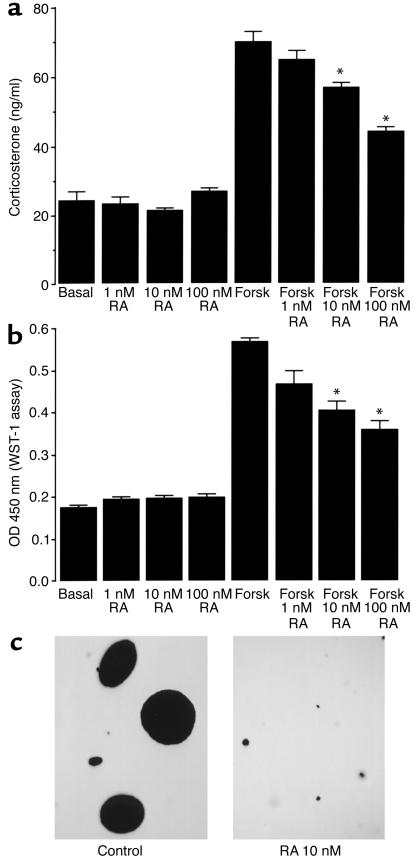
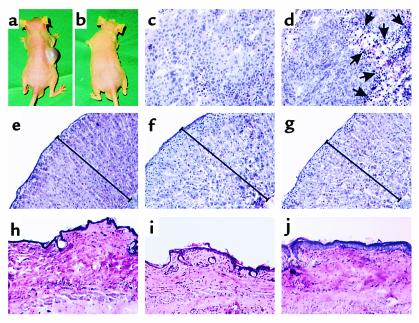
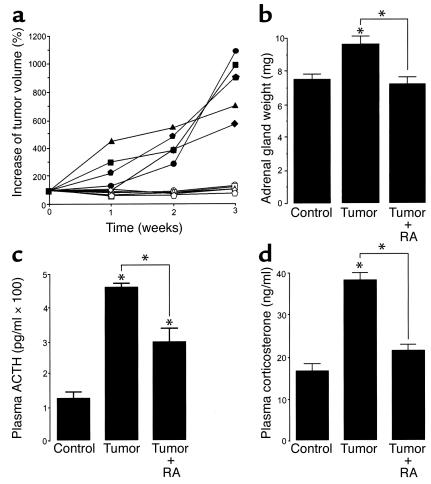
Cushing syndrome is caused by an excess of adrenocorticotropic hormone (ACTH) production by neuroendocrine tumors, which subsequently results in chronic glucocorticoid excess. We found that retinoic acid inhibits the transcriptional activity of AP-1 and the orphan receptors Nur77 and Nurr1 in ACTH-secreting tumor cells. Retinoic acid treatment resulted in reduced pro-opiomelanocortin transcription and ACTH production. ACTH inhibition was also observed in human pituitary ACTH-secreting tumor cells and a small-cell lung cancer cell line, but not in normal cells. This correlated with the expression of the orphan receptor COUP-TFI, which was found in normal corticotrophs but not in pituitary Cushing tumors. COUP-TFI expression in ACTH-secreting tumor cells blocked retinoic acid action. Retinoic acid also inhibited cell proliferation and, after prolonged treatment, increased caspase-3 activity and induced cell death in ACTH-secreting cells. In adrenal cortex cells, retinoic acid inhibited corticosterone production and cell proliferation. The antiproliferative action and the inhibition of ACTH and corticosterone produced by retinoic acid were confirmed in vivo in experimental ACTH-secreting tumors in nude mice. Thus, we conclude that the effects of retinoic acid combine in vivo to reverse the endocrine alterations and symptoms observed in experimental Cushing syndrome.


Figures

Figure 1
Figure 1
Retinoic acid inhibits NurRE-directed POMC transcription. AtT-20 cells were transfected with AP-1-LUC (a), NurRE-LUC (b), NBRE-LUC (c), CRE-LUC (d), GRE-LUC (e), POMC-LUC (f), or POMC-mut-NurRE-LUC (g) or cotransfected with POMC-LUC and COUP-TFI expression vector or control vector (h), and treated with 10 nM retinoic acid (RA), 100 nM CRH, 100 nM dexamethasone (Dex), or 5 μM forskolin (Forsk) or their combinations, as indicated. After a 6-hour treatment, luciferase activity was measured and normalized as described in Methods. Values indicate the mean ± SE of luciferase-to-β-galactosidase ratio of one representative experiment out of three, each of them with triplicates of each treatment. *P < 0.01 compared with the corresponding basal values, **P < 0.01 compared with CRH or forskolin stimulation, determined by ANOVA in combination with the Scheffé test. Similar results were obtained after a 24-hour treatment with retinoic acid.
Figure 2
Figure 2
Retinoic acid inhibits ACTH production. AtT-20 cells were treated for 2 or 24 hours with 1 or 10 nM retinoic acid, 100 nM CRH, or 1, 10, or 100 nM dexamethasone (Dex), or their combinations as indicated. ACTH was measured in the supernatants by RIA. Averages of four wells per treatment and SEs from one representative experiment out of three are shown. *P < 0.01 compared with the basal values, **P < 0.01 compared with CRH stimulation, determined by ANOVA in combination with the Scheffé test.
Figure 3
Figure 3
Retinoic acid specifically inhibits ACTH production in human neuroendocrine tumors. (a) Human pituitary adenoma cells from eight patients with Cushing disease were treated with 10 nM or 100 nM retinoic acid (RA) for 24 hours, and ACTH was measured by RIA in the supernatants. Values at the top represent the basal ACTH production of each tumor, and the bars indicate percentages of these values after retinoic acid treatment. (b) NCI-N-592 small-cell lung cancer cells were treated with retinoic acid. After 24 hours, ACTH was measured in the supernatants. (ce) Normal rat pituitary cells were treated for 24 hours with retinoic acid (RA), 5 μM forskolin (Forsk), 10 nM hydrocortisone (HC), 100 nM thyrotropin-releasing hormone (TRH), 1 μM bromocriptine (BrCr), 100 nM growth hormone–releasing hormone (GHRH), or 100 nM octreotide (Oct). Supernatants were collected and ACTH (c), prolactin (d), and growth hormone (GH) (e) were measured by RIA. Averages of four wells per treatment and the corresponding SEs are shown. *P < 0.001 compared with the corresponding basal values, **P < 0.01 compared with the stimulated values, determined by ANOVA in combination with the Scheffé test. be are representative of three independent experiments. (f) COUP-TFI expression was detected in normal human pituitary (n = 3) by immunoperoxidase staining (diaminobenzidine brown color). Inset: negative control. (g) Double immunohistochemistry for COUP-TFI (brown color, filled arrows) and ACTH (vector red color, open arrows). (h) COUP-TFI immunohistochemistry in Cushing adenomas was negative (n = 7).
Figure 4
Figure 4
Retinoic acid inhibits proliferation and induces apoptosis. (a) AtT-20 cells were treated for 3 days with retinoic acid (RA). Proliferation was measured by 3H-thymidine incorporation. (b) AtT-20 cells were treated for 24 hours with 10 nM retinoic acid and seeded in soft agar. After 20 days, the colonies were stained with MTT and photographed. The control shows colonies composed of more than 300 cells. Retinoic acid–treated cells formed colonies composed of less than ten viable cells. (ch) AtT-20 cells were stained with annexin V-FITC and photographed under ultraviolet (c, e, and g) or white light (d, f, and h). (c and d) Cells were treated with 1 μM H2O2 as a positive control for annexin staining induced by apoptosis. Cells were treated with 10 nM retinoic acid for 6 hours (e and f) or 24 hours (g and h). (i) AtT-20 cells were treated with 10 nM retinoic acid. At different times cells were collected, and their vitality was assessed by acridine orange–ethidium bromide staining. Caspase-3 activity was measured as indicated in Methods. (j) Cell viability was measured after 7 days using the WST-1 assay. The dotted line indicates the WST-1 values at the beginning of the treatment. Averages of four wells per treatment and SEs from one representative experiment are shown. *P < 0.01, **P < 0.001 compared with the corresponding basal or control values, determined by ANOVA in combination with the Scheffé test. The results are representative of four independent experiments.
Figure 5
Figure 5
Retinoic acid inhibits corticosterone production and adrenal cortex cell proliferation. (a) y1 adrenal cortex cells were treated for 24 hours with retinoic acid (RA) or 5 μM forskolin (Forsk) as indicated. Supernatants were collected and corticosterone was measured by RIA. (b) y1 cells were treated for 3 days with retinoic acid (RA). Proliferation was measured by WST-1 assay. In a and b averages of four wells per treatment and SEs are shown. *P < 0.001 compared with the forskolin stimulation, determined by ANOVA in combination with the Scheffé test. (c) y1 cells were treated for 24 hours with 10 nM retinoic acid, seeded in soft agar, stained with MTT, and photographed after 20 days. The control shows colonies composed of more than 300 cells. Retinoic acid–treated cells formed colonies composed of less than ten viable cells. These results are representative of three independent experiments with triplicates of each treatment.
Figure 6
Figure 6
Retinoic acid inhibits tumor formation and the symptoms of Cushing syndrome. AtT-20 cells were treated with vehicle (a) or 10 nM retinoic acid (b) for 3 hours and then injected into nude mice. (a and b) Representative examples of the mice after 5 weeks (n = 10 in each treatment). Notice the 12-mm-diameter tumor developed by vehicle-treated cells (a). Thinning of the skin was consistently observed in mice with tumors (a). (cj) Mice with tumors were injected intraperitoneally with 10 mg/kg retinoic acid or vehicle (n = 5 in each experiment) every 4 days for 3 weeks. At the end of the treatment the tumors (c and d) (arrows indicate areas of necrosis), adrenal glands (eg), and skin samples (hj) were shock-frozen and analyzed by hematoxylin-eosin staining. Adrenals (e) and skin (h) from vehicle-treated mice without tumors. Tumor (c), adrenals (f), and skin (i) from vehicle-treated mice with tumors. Tumor (d), adrenals (g), and skin (j) from retinoic acid–treated mice with tumors. These results are representative of two independent experiments.
Figure 7
Figure 7
Retinoic acid inhibits tumor growth and endocrine alterations. (a) Mice with 2-week-old tumors formed with untreated AtT-20 cells were injected intraperitoneally with 10 mg/kg retinoic acid (open symbols, RA) or vehicle (filled symbols) every 4 days for 3 weeks. Tumor volume was monitored during this period. Results show the increase in percentage over the initial tumor volume. Each curve represents a single tumor. (b) At the end of the treatment the weight of the adrenal glands was measured in mice without tumors (control, n = 5) and in mice with tumors with or without retinoic acid treatment (RA) as indicated (n = 5 for each treatment). (c and d) At the end of the treatment blood was collected and ACTH and corticosterone were measured by RIA. Values indicate the mean ± SE of one experiment. *P < 0.01, as determined by ANOVA in combination with the Scheffé test. The results are representative of two independent experiments.

References

    1. Orth DN. Cushing’s syndrome. N Engl J Med. 1995;332:791–803. - PubMed
    1. Dahia PLM, Grossman A. The molecular pathogenesis of corticotroph tumors. Endocr Rev. 1999;20:136–155. - PubMed
    1. Wajchenberg BL, et al. Ectopic adrenocorticotropic hormone syndrome. Endocr Rev. 1994;15:752–787. - PubMed
    1. Engler D, Redei E, Kola I. The corticotropin-release inhibitory factor hypothesis: a review of the evidence for the existence of inhibitory as well as stimulatory hypophysiotropic regulation of adrenocorticotropin secretion and biosynthesis. Endocr Rev. 1999;20:460–500. - PubMed
    1. Therrien M, Drouin J. Pituitary pro-opiomelanocortin gene expression requires synergistic interactions of several regulatory elements. Mol Cell Biol. 1991;11:3492–3503. - PMC - PubMed

Publication types

MeSH terms