

Recruitment times, proliferation, and apoptosis rates during the CD8(+) T-cell response to lymphocytic choriomeningitis virus
- PMID: 11602708
- PMCID: PMC114648
- DOI: 10.1128/JVI.75.22.10663-10669.2001
Recruitment times, proliferation, and apoptosis rates during the CD8(+) T-cell response to lymphocytic choriomeningitis virus
Abstract
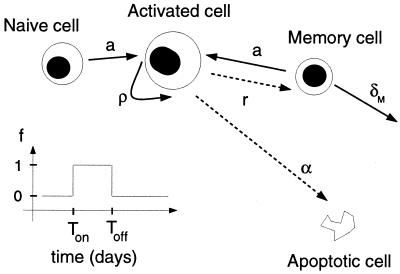
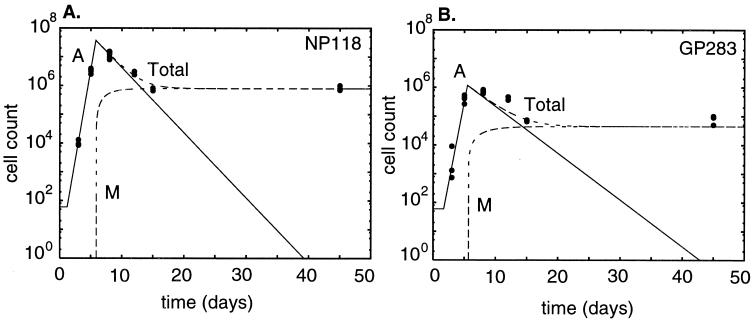
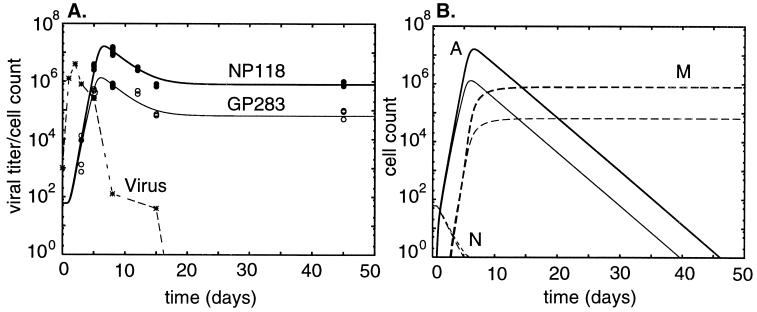
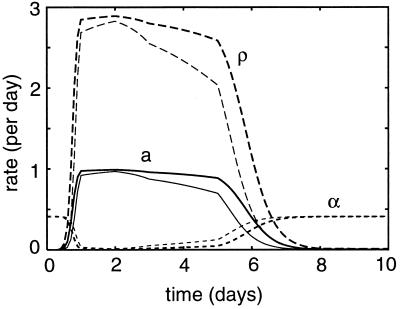
The specific CD8(+) T-cell response during acute lymphocytic choriomeningitis virus (LCMV) infection of mice is characterized by a rapid proliferation phase, followed by a rapid death phase and long-term memory. In BALB/c mice the immunodominant and subdominant CD8(+) responses are directed against the NP118 and GP283 epitopes. These responses differ mainly in the magnitude of the epitope-specific CD8(+) T-cell expansion. Using mathematical models together with a nonlinear parameter estimation procedure, we estimate the parameters describing the rates of change during the three phases and thereby establish the differences between the responses to the two epitopes. We find that CD8(+) cell proliferation begins 1 to 2 days after infection and occurs at an average rate of 3 day(-1), reaching the maximum population size between days 5 and 6 after immunization. The 10-fold difference in expansion to the NP118 and GP283 epitopes can be accounted for in our model by a 3.5-fold difference in the antigen concentration of these epitopes at which T-cell stimulation is half-maximal. As a consequence of this 3.5-fold difference in the epitope concentration needed for T-cell stimulation, the rates of activation and proliferation of T cells specific for the two epitopes differ during the response and in combination can account for the large difference in the magnitude of the response. After the peak, during the death phase, the population declines at a rate of 0.5 day(-1), i.e., cells have an average life time of 2 days. The model accounts for a memory cell population of 5% of the peak population size by a reversal to memory of 1 to 2% of the activated cells per day during the death phase.
Figures
References
-
- Abbas A K. Die and let live: eliminating dangerous lymphocytes. Cell. 1996;84:655–657. - PubMed
-
- Ahmed R, Gray D. Immunological memory and protective immunity: understanding their relation. Science. 1996;272:54–60. - PubMed
-
- Akbar A N, Salmon M. Cellular environments and apoptosis: tissue microenvironments control activated T-cell death. Immunol Today. 1997;18:72–76. - PubMed
Publication types
MeSH terms
Substances
Grants and funding
LinkOut - more resources
Full Text Sources
Research Materials
