. 2001 Nov;21(22):7682-95.
doi: 10.1128/MCB.21.22.7682-7695.2001.

Nucleosomes are translationally positioned on the active allele and rotationally positioned on the inactive allele of the HPRT promoter

Affiliations

Nucleosomes are translationally positioned on the active allele and rotationally positioned on the inactive allele of the HPRT promoter

C Chen et al. Mol Cell Biol. 2001 Nov.

Abstract

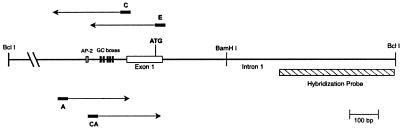
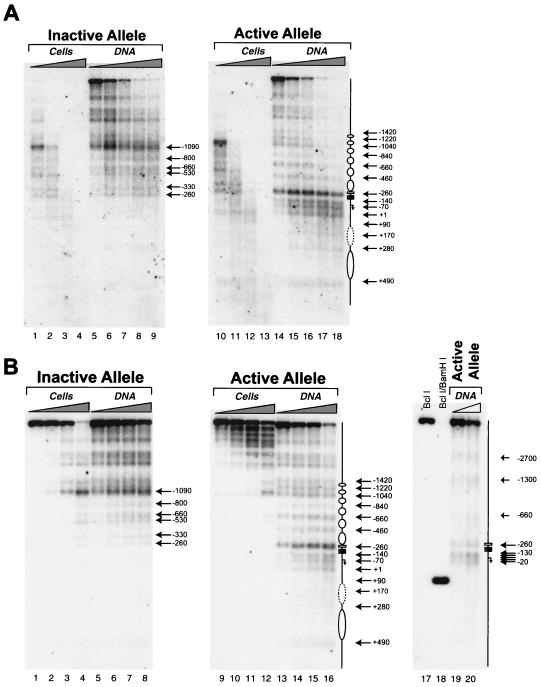
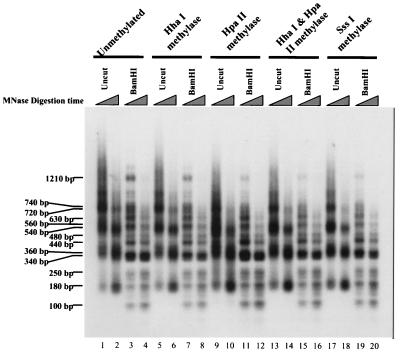
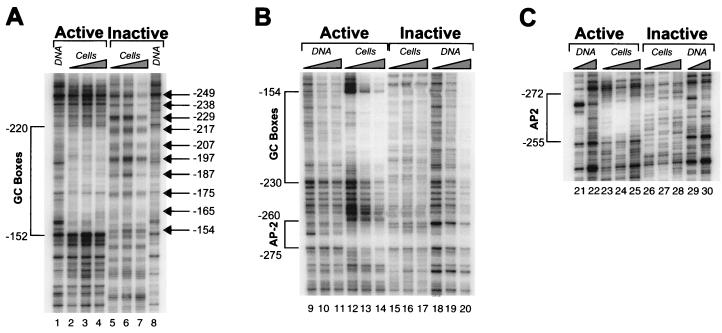
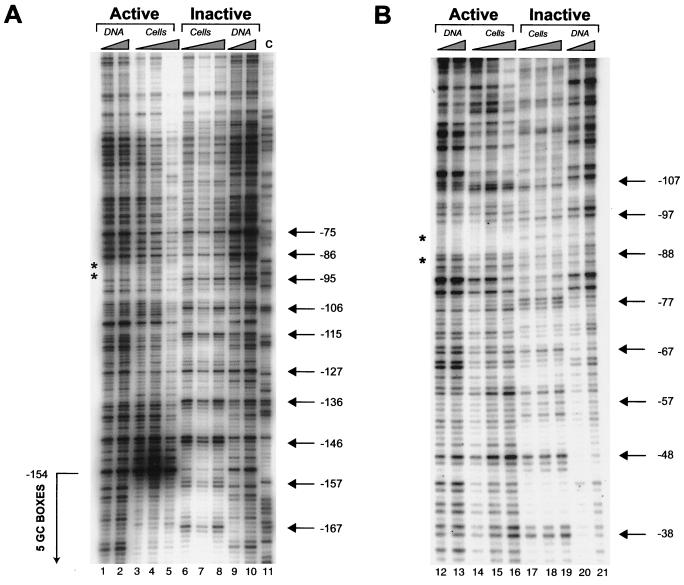
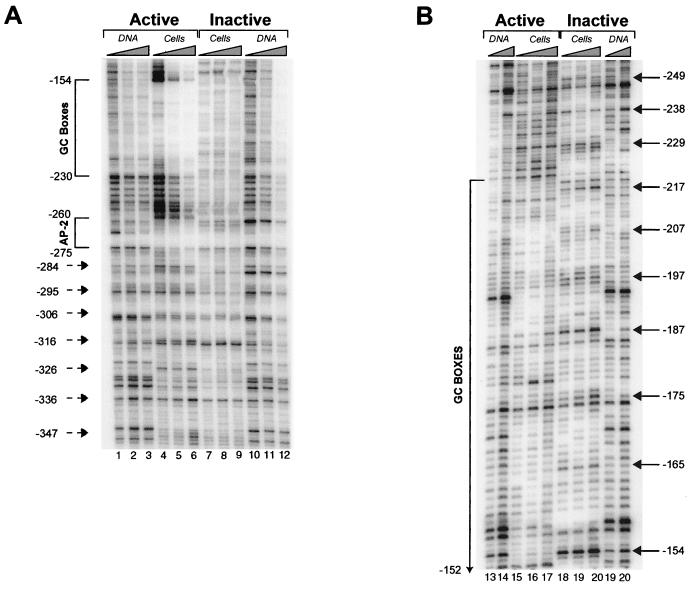
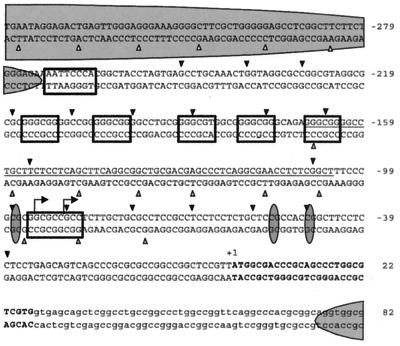
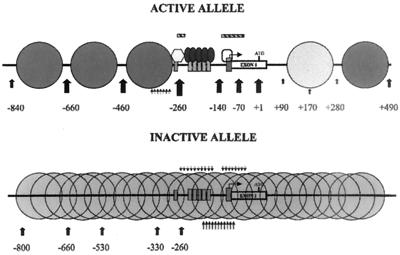
Differential chromatin structure is one of the hallmarks distinguishing active and inactive genes. For the X-linked human hypoxanthine phosphoribosyltransferase gene (HPRT), this difference in chromatin structure is evident in the differential general DNase I sensitivity and hypersensitivity of the promoter regions on active versus inactive X chromosomes. Here we characterize the nucleosomal organization responsible for the differential chromatin structure of the active and inactive HPRT promoters. The micrococcal nuclease digestion pattern of chromatin from the active allele in permeabilized cells reveals an ordered array of translationally positioned nucleosomes in the promoter region except over a 350-bp region that is either nucleosome free or contains structurally altered nucleosomes. This 350-bp region includes the entire minimal promoter and all of the multiple transcription initiation sites of the HPRT gene. It also encompasses all of the transcription factor binding sites identified by either dimethyl sulfate or DNase I in vivo footprinting of the active allele. In contrast, analysis of the inactive HPRT promoter reveals no hypersensitivity to either DNase I or a micrococcal nuclease and no translational positioning of nucleosomes. Although nucleosomes on the inactive promoter are not translationally positioned, high-resolution DNase I cleavage analysis of permeabilized cells indicates that nucleosomes are rotationally positioned over a region of at least 210 bp on the inactive promoter, which coincides with the 350-bp nuclease-hypersensitive region on the active allele, including the entire minimal promoter. This rotational positioning of nucleosomes is not observed on the active promoter. These results suggest a model in which the silencing of the HPRT promoter during X chromosome inactivation involves remodeling a transcriptionally competent, translationally positioned nucleosomal array into a transcriptionally repressed architecture consisting of rotationally but not translationally positioned nucleosomal arrays.


Figures

FIG. 1
FIG. 1
Locations of probes and primers for analysis of the HPRT promoter region. Horizontal line bounded by BclI sites, 4.3-kb BclI fragment containing the HPRT promoter; gray box, potential AP-2 site; five black boxes, cluster of GC boxes in the HPRT promoter; white box, first exon of the HPRT gene including the region of multiple transcription initiation sites in the promoter; ATG, translation initiation site; BamHI, position of a reference BamHI site in the first intron 100 bp downstream of the translation initiation site; hatched box, position of the 400-bp hybridization probe used to map DNase I and MNase cleavage sites in the HPRT promoter by indirect end labeling; black rectangles above and below the line, positions of the LMPCR primer sets used to map the high-resolution DNase I cleavage pattern of the HPRT minimal promoter; arrows extending from the black boxes, strand and region analyzed with each primer set.
FIG. 2
FIG. 2
Mapping of MNase cleavage sites and DNase I-hypersensitive sites on the active and inactive HPRT promoters in vivo. (A) Mapping of nucleosome positions on the inactive and active HPRT promoters by MNase digestion. All lanes are from the same gel and autoradiogram and are aligned accordingly. All designations and symbols are described below. (B) Mapping of DNase I-hypersensitive sites relative to MNase cleavage sites. All lanes are from the same gel and autoradiogram and are aligned accordingly. Lanes 1 to 16, MNase-treated samples; lanes 17 to 20, DNase I-treated samples. MNase-treated samples in panel B were digested with lower concentrations of MNase than were samples in panel A. Band BclI (lane 17), position of the full-length genomic BclI fragment containing the HPRT promoter in purified genomic DNA; band BclI/BamHI (lane 18), relative position of a BamHI site 100 bp downstream of the translation initiation site within the full-length BclI genomic DNA fragment (Fig. 1). Lanes 19 and 20 (active allele), relative positions of DNase I-hypersensitive sites on the active HPRT allele; the diagram to the right indicates the positions of the DNase I-hypersensitive sites relative to those of the transcription factor binding sites (small boxes) and the major transcription initiation sites of the HPRT promoter (bent arrow) and the direction of transcription (Fig. 1). All bands in the Southern blots (A and B) were visualized by indirect labeling with a radiolabeled 400-bp probe located just upstream of a reference BclI site 838 bp downstream of the translation initiation site of the HPRT gene (Fig. 1). The diagrams to the right of lanes from the active allele (A, lanes 10 to 18, and B, lanes 9 to 16) indicate the translational positions of nucleosomes (ovals) on the active HPRT promoter relative to transcription factor binding sites (small boxes) as determined by the in vivo MNase cleavage pattern. The dashed oval indicates that the first downstream nucleosome may be modified, shifted, or absent in a subpopulation of cells since an “intranucleosomal” MNase cleavage occurs at position +170 (see text). Numbers to the right of the autoradiogram indicate the positions of MNase or DNase I cleavage sites relative to the translation initiation site. Active allele, samples from 4.12 cells containing an active HPRT gene on the active human X chromosome; inactive allele, samples from 8121 cells containing an inactive HPRT gene on the inactive human X chromosome; cells, DNA from permeabilized cells; DNA, naked DNA treated with MNase. All position numbers are relative the translation initiation site of the HPRT gene.
FIG. 3
FIG. 3
Effects of DNA methylation on the translational positioning of nucleosomes on the human HPRT promoter in vitro. Nucleosomes were assembled in vitro onto methylated and unmethylated DNA templates containing the human HPRT promoter. HpaII methylase, HhaI methylase, and SssI methylase, DNA methyltransferases used to methylate each template; uncut, reconstituted chromatin that was digested with MNase but not BamHI; BamHI, reconstituted chromatin that was digested with MNase, purified, and then digested with BamHI. All samples were probed with BamHINuc1Probe, an 18-mer oligonucleotide immediately upstream of the BamHI site in the first intron of the HPRT gene. Triangles indicate increasing MNase digestion times used to cleave the reconstituted chromatin. Numbers to the left, approximate sizes of the bands.
FIG. 4
FIG. 4
DNase I in vivo footprint analysis of the human HPRT promoter. Active, samples from cells containing an active HPRT gene on the active human X chromosome; inactive, samples from cells containing an inactive HPRT gene on the inactive human X chromosome; DNA, naked DNA treated with DNase I; cells, DNA from permeabilized cells treated with DNase I; GC boxes, position of a DNase I in vivo footprint over the five GC boxes in the human HPRT promoter; AP-2, position of a DNase I in vivo footprint over a putative consensus AP-2 site in the human HPRT promoter. All position numbers (left and right) are relative to the translation initiation site of the HPRT gene. (A) DNase I in vivo footprint analysis of the upper strand of the HPRT promoter using LMPCR primer set E. Ladder of arrows, apparent 10-bp ladder of DNase I cleavages in permeabilized cells consistent with rotationally positioned nucleosomes on the inactive HPRT promoter. (B) DNase I in vivo footprinting analysis of the lower strand of the HPRT promoter using LMPCR primer set A. All designations and symbols are as described above. This analysis identifies footprints over both a cluster of five GC boxes and a putative AP-2 site in the active HPRT promoter. (C) DNase I in vivo footprinting analysis of the upper strand using LMPCR primer set C. All designations and symbols are as described above. This analysis identifies a DNase in vivo footprint over a putative AP-2 site on the active HPRT promoter.
FIG. 5
FIG. 5
DNase I cleavage analysis of the HPRT promoter using LMPCR primer sets CA and E. All designations are the same as for Fig. 4. Asterisks, positions of the two major transcription initiation sites of the HPRT promoter determined by Kim et al. (16); arrows, 10-base ladders suggestive of rotational positioning of nucleosomes on the inactive HPRT allele. (A) DNase I cleavage analysis of the lower strand of the HPRT promoter using LMPCR primer set CA. (B) DNase I cleavage analysis of the upper strand of the HPRT promoter using LMPCR primer set E.
FIG. 6
FIG. 6
DNase I cleavage analysis of the HPRT minimal promoter using LMPCR primer sets A and C. All designations are the same as for Fig. 4 and 5. Dashed arrows, 10-base cleavage ladder suggestive of a rotationally positioned nucleosome on the active HPRT promoter. (A) DNase I cleavage analysis of the lower strand immediately upstream of the HPRT promoter using LMPCR primer set A. (B) DNase I cleavage analysis of the upper strand immediately upstream of the HPRT promoter using LMPCR primer set C.
FIG. 7
FIG. 7
Summary of the 10-base DNase I cleavage ladders of chromatin from the active and inactive HPRT promoters. Boldface letters, protein-coding region of the first exon; lowercase letters, nucleotides within the first intron; partial ovals, approximate positions of the translationally positioned nucleosomes on the active HPRT promoter as determined by MNase cleavage; open boxes, positions of transcription factor (TF) binding sites. From top to bottom, left to right, the TF binding sites are a putative AP-1 site (−271 to −264), five GC boxes (centered at −213, −201, −187, −177, and −166), and a putative initiator element (−94 to −86). Bent arrows, positions of the two major transcription initiation sites identified by Kim et al. (16); line between the nucleotide sequence of the upper and lower strands, region of multiple transcription initiation sites described by Patel et al. (32); black triangles above the sequence, positions of DNase I cleavage sites on the upper strand comprising the 10-bp ladder suggestive of rotationally positioned nucleosomes in the inactive promoter; gray triangles below the sequence, positions of DNase I cleavages on the lower strand comprising the 10-bp ladder suggestive of rotationally positioned nucleosomes in the inactive promoter; white triangles, positions of DNase I cleavages on the lower strand making up the 10-bp ladder, suggestive of rotational positioning of a nucleosome on the active promoter region in permeabilized cells; vertical ovals, positions of three CpG dinucleotides whose methylation is strongly correlated with transcriptional repression of the HPRT gene on the inactive allele (6).
FIG. 8
FIG. 8
Summary of the nucleosomal organization of the active and inactive HPRT promoter regions. Large dark gray circles on the active allele, positions of translationally positioned nucleosomes; light gray circle on the active allele, first nucleosome downstream of the promoter, which may be modified, shifted, or absent in a subpopulation of cells since an intranucleosomal MNase cleavage occurs at position +170 (see text); large gray overlapping circles on the inactive allele, nucleosomes with random translational positioning on the inactive promoter; hexagon and vertical ovals, bound transcription factors identified by DNase I and DMS in vivo footprinting (13) (vertical rectangles, their binding sites); bent arrow, position of the two major transcription initiation sites on the HPRT promoter; white box, first exon of the HPRT gene; ATG, position of the translation initiation site; thick vertical arrows, approximate positions and relative intensities of the major MNase cleavage sites in the HPRT promoter; clusters of thin triangular dashed arrows and barbed arrows, positions of the high-resolution DNase I cleavage ladders suggestive of rotationally positioned nucleosomes on the active and inactive HPRT promoters, respectively, in permeabilized cells (the slightly longer arrows on the lower strand in the inactive allele indicate that this ladder was unusually prominent); hatched bars, approximate locations of the DNase I-hypersensitive sites on the active HPRT promoter in permeabilized cells; All position numbers are relative to the translation initiation site.

Similar articles

Cited by

References

    1. Becker P B, Tsukiyama T, Wu C. Chromatin assembly extracts from Drosophila embryos. Methods Cell Biol. 1994;44:207–223. - PubMed
    1. Belikov S, Gelius B, Almouzni G, Wrange O. Hormone activation induces nucleosome positioning in vivo. EMBO J. 2000;19:1023–1033. - PMC - PubMed
    1. Benezra R, Cantor C R, Axel R. Nucleosomes are phased along the mouse beta-major globin gene in erythroid and nonerythroid cells. Cell. 1986;44:697–704. - PubMed
    1. Blomquist P, Belikov S, Wrange O. Increased nuclear factor 1 binding to its nucleosomal site mediated by sequence-dependent DNA structure. Nucleic Acids Res. 1999;27:517–525. - PMC - PubMed
    1. Buckle R, Balmer M, Yenidunya A, Allan J. The promoter and enhancer of the inactive chicken beta-globin gene contains precisely positioned nucleosomes. Nucleic Acids Res. 1991;19:1219–1226. - PMC - PubMed

Publication types

LinkOut - more resources