. 2001 Oct 23;98(22):12766-71.
doi: 10.1073/pnas.231235598. Epub 2001 Oct 16.

Functional magnetic resonance imaging of reorganization in rat brain after stroke

Affiliations

Functional magnetic resonance imaging of reorganization in rat brain after stroke

R M Dijkhuizen et al. Proc Natl Acad Sci U S A. .

Abstract

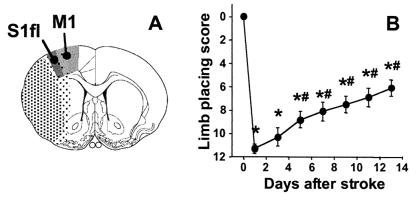
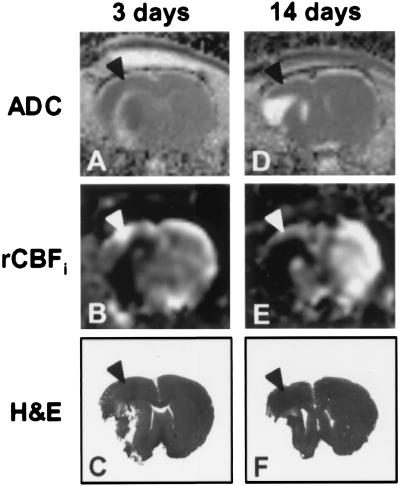
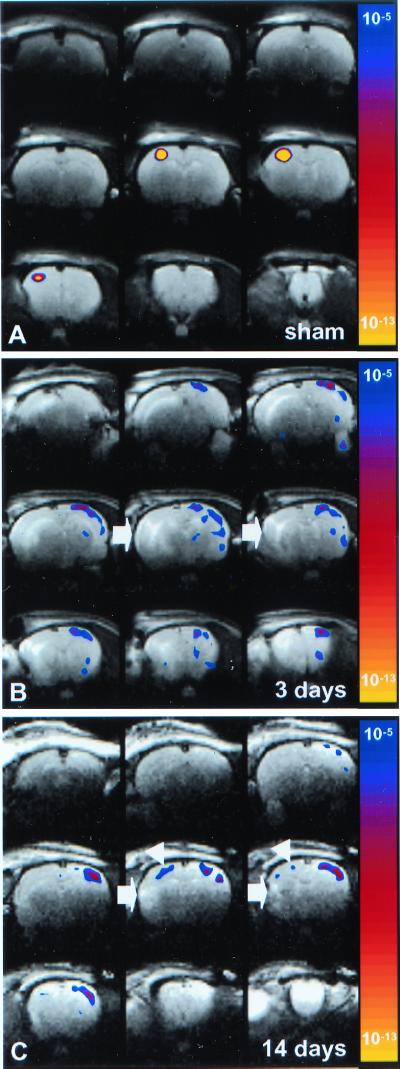
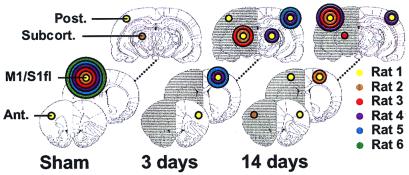
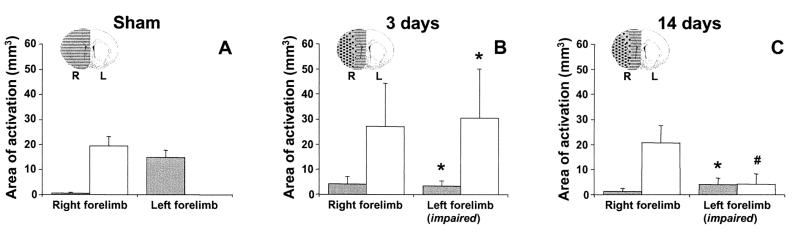
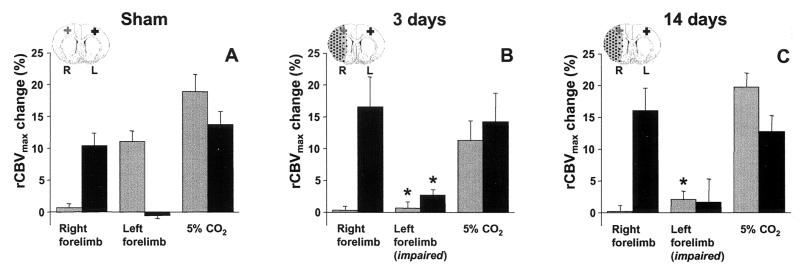
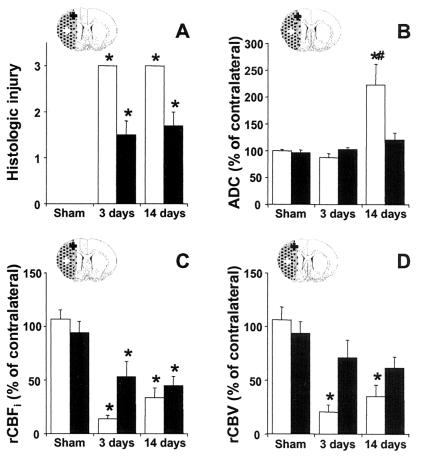
Functional recovery after stroke has been associated with brain plasticity; however, the exact relationship is unknown. We performed behavioral tests, functional MRI, and histology in a rat stroke model to assess the correlation between temporal changes in sensorimotor function, brain activation patterns, cerebral ischemic damage, and cerebrovascular reactivity. Unilateral stroke induced a large ipsilateral infarct and acute dysfunction of the contralateral forelimb, which significantly recovered at later stages. Forelimb impairment was accompanied by loss of stimulus-induced activation in the ipsilesional sensorimotor cortex; however, local tissue and perfusion were only moderately affected and cerebrovascular reactivity was preserved in this area. At 3 days after stroke, extensive activation-induced responses were detected in the contralesional hemisphere. After 14 days, we found reduced involvement of the contralesional hemisphere, and significant responses in the infarction periphery. Our data suggest that limb dysfunction is related to loss of brain activation in the ipsilesional sensorimotor cortex and that restoration of function is associated with biphasic recruitment of peri- and contralesional functional fields in the brain.


Figures

Figure 1
Figure 1
(A) Schematic delineation of the location of cerebral infarction (stippled area) on an outline of a coronal rat brain section centered 0.7 mm from bregma [reproduced from Paxinos and Watson (18), with permission from Academic Press]. Dark stippling represents the ischemic core. The weakly stippled periphery, which includes the sensorimotor cortex, is irregularly affected. S1fl, forelimb region of the primary somatosensory cortex; M1, primary motor cortex (18). (B) Contralateral (left) forelimb placing scores as a function of time after unilateral (right) stroke (data from the 2 weeks animal group). *, P < 0.05 vs. before stroke; #, P < 0.05 vs. 1 day after stroke.
Figure 2
Figure 2
ADC maps (A and D), rCBFi maps (B and E), and hematoxylin and eosin (H&E)-stained sections (C and F) of a coronal rat brain slice at 3 (AC) and 14 days after unilateral stroke (DF). Each column represents data from a single animal. Note that M1/S1fl (arrowheads) was at the border of the lesion and relatively mildly affected.
Figure 3
Figure 3
T2-weighted images of coronal rat brain slices overlaid by statistical activation maps, calculated from the cross-correlation between the left (impaired) forelimb stimulation paradigm and local cerebral rCBV changes. The map of P values has been color-coded corresponding to the degree of significance. (A) 14 days after sham-operation (Rat 5); (B) 3 days after stroke (Rat 4); (C) 14 days after stroke (Rat 1). Left forelimb stimulation induced significant activation responses in the contralateral (right) M1/S1fl in sham-operated rats. At 3 days after stroke, no significant activation was detected in the right, ipsilesional M1/S1fl. However, clear responses were found in the contralesional hemisphere, extending over the entire neocortex. After 14 days, activation responses appeared both contralesional and ipsilesional; however, shifted from M1/S1fl (white arrowheads). The area of infarction is characterized by increased T2-weighted signal intensity (white arrows).
Figure 4
Figure 4
Distribution of regions that exhibited significant activation responses on stimulation of the left (impaired) forelimb, schematically represented on coronal rat brain sections at 2.7, 0.7, and −5.3 mm from bregma. For the sake of clarity, regions are divided into four main areas: (i) M1/S1fl; (ii) anterior (Ant.) vicinity of M1/S1fl (i.e., face region of S1; cingulate cortex; insular cortex); (iii) posterior (Post.) vicinity of M1/S1fl (i.e., hindlimb, barrel field, dysgranular, and trunk region of S1; parietal association cortex; visual cortex); and (iv) subcortical (Subcort.) (thalamus; superior colliculus). The radius of the colored circles corresponds with the number of animals that showed significant activation responses in the specific brain region (P < 5 × 10⁻⁵ was considered significant). The different colors represent individual animals in the sham-operated group, the 3 days stroke group, and the 14 days stroke group. The ipsilesional (right) hemisphere is shaded.
Figure 5
Figure 5
Total area of significant activation responses in the right (ipsilesional) hemisphere (gray bars) and left (contralesional) hemisphere (white bars) during stimulation of the right and left forelimb in sham-operated rats (A), and in rats at 3 (B) and 14 days (C) after stroke. *, P < 0.05 vs. sham-operated rats; #, P < 0.05 vs. 3 days after stroke. The right (R, ipsilesional; gray) and left (L, contralesional; white) hemispheres and the ischemic lesion (stippled) are schematically represented on inserted outlines of a coronal rat brain section.
Figure 6
Figure 6
Plateau rCBV change (rCBVmax) in the right (ipsilesional; gray bars) and left (contralesional; black bars) M1/S1fl during stimulation of the right (unimpaired) and left (impaired) forelimb, and during 5% CO2 inhalation, in sham-operated rats (A), and in rats at 3 (B) and 14 days (C) after stroke. *, P < 0.05 vs. sham-operated rats. ROIs in the right (R, ipsilesional; gray cross) and left (L, contralesional; black cross) M1/S1fl are schematically represented on inserted outlines of a coronal rat brain section. The ischemic lesion is stippled.
Figure 7
Figure 7
Histologic tissue injury (A), relative ADC (B), rCBFi (C), and rCBV (D) in the ischemic core (white bars) and in ipsilesional M1/S1fl (black bars) at 3 and 14 days after stroke. *, P < 0.05 vs. sham-operated rats; #, P < 0.05 vs. 3 days after stroke. ROIs in the ipsilesional M1/S1fl (black cross) and ischemic core (white cross) are schematically represented on inserted outlines of a coronal rat brain section. The ischemic lesion is stippled.

References

    1. Bogousslavsky J, Van Melle G, Regli F. Stroke. 1988;19:1083–1092. - PubMed
    1. Lee R G, van Donkelaar P. Can J Neurol Sci. 1995;22:257–263. - PubMed
    1. Seil F J. Curr Opin Neurol. 1997;10:49–51. - PubMed
    1. Steinberg B A, Augustine J R. Brain Res Brain Res Rev. 1997;25:125–132. - PubMed
    1. Weiller C. Exp Brain Res. 1998;123:13–17. - PubMed

Publication types