. 2001 Nov 6;98(23):13037-42.
doi: 10.1073/pnas.231485698. Epub 2001 Oct 23.

Identification of sites for exponential translation in living dendrites

Affiliations

Identification of sites for exponential translation in living dendrites

C Job et al. Proc Natl Acad Sci U S A. .

Abstract

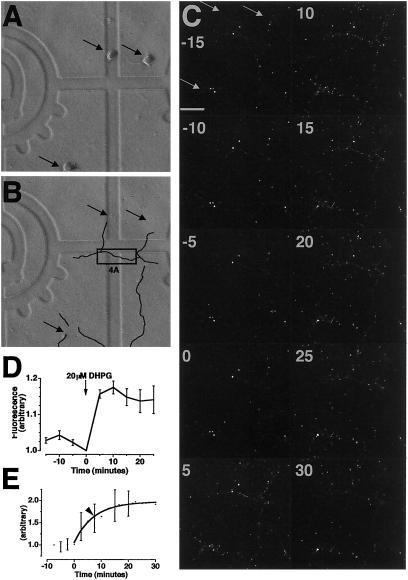
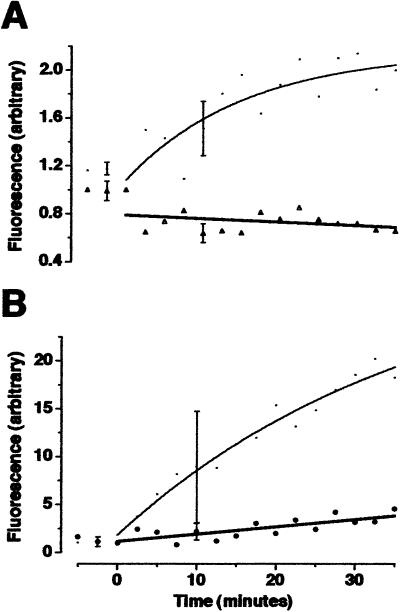
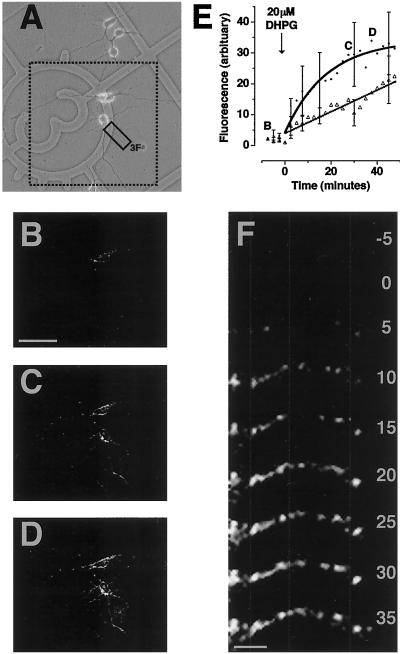
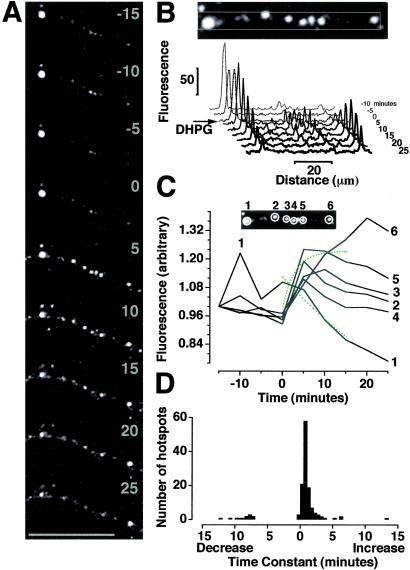
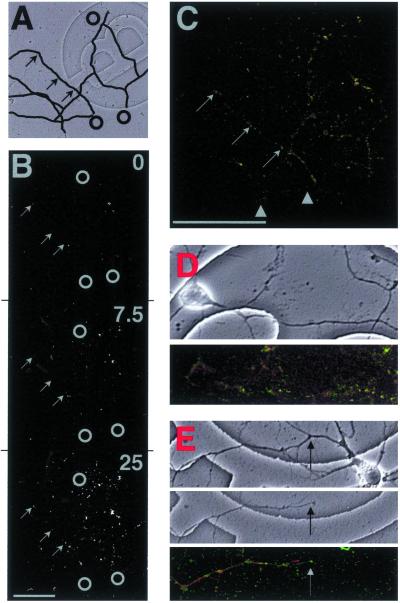
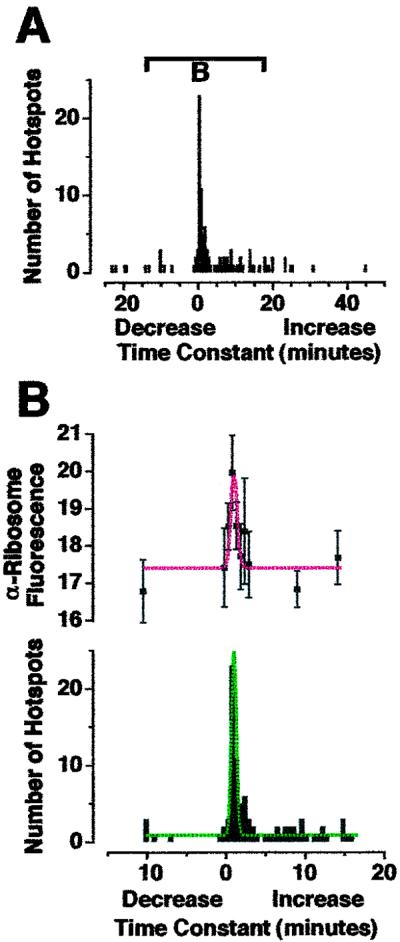
Neuronal processes contain mRNAs and membrane structures, and some forms of synaptic plasticity seem to require protein synthesis in dendrites of hippocampal neurons. To quantitate dendritic protein synthesis, we used multiphoton microscopy of green fluorescent protein synthesized in living isolated dendrites. Transfection of dendrites with mRNA encoding green fluorescent protein resulted in fluorescence that exponentially increased on stimulation with a glutamate receptor agonist; a reaction attenuated by the translation inhibitors anisomycin and emetine. Comparable experiments on whole neurons revealed that (RS)-3,5-dihydroxy-phenylglycine 0.5 H(2)O (DHPG)-stimulated fluorescence was linear in cell bodies relative to the exponential increase seen in dendrites. Detailed spatial analysis of the subdendritic distribution of fluorescence revealed "hotspots," sites of dendritic translation that were spatially stable. However, detailed temporal analysis of these hotspots revealed heterogeneous rates of translation. A double-label protocol counterstaining for ribosomes indicated that sites of "fastest" translation correlated with increased ribosome density, consistent with ribosome subunit assembly for initiation, the first step of translation. We propose that dendrites have specific sites specialized for fast translation.


Figures

Figure 1
Figure 1
Transfection of isolated dendrites with GFP mRNA resulted in fluorescence that increased exponentially when the dendrites were stimulated with DHPG. (A and B) Phase images of 4-day-old primary hippocampal neurons grown on gridded coverslips. Arrows indicate positions of cell bodies removed with a micropipette. (B) Bold black lines highlight positions of dendrites in image A that were transfected with GFP mRNA. Black box indicates site of example dendrite shown in detail in Fig. 4A. [Square = 175 μm2.] (C) Fluorescence images acquired by MPLSM every 5 min, before (first 4 images) and after addition of DHPG to a final concentration of 20 μM. (C 15) Arrows indicate sites of removed cell bodies from A. [Bar = 50 μm.] (D) Mean fluorescence per pixel in ROIs around 7 dendrites (observed within the field of view in C) over a time course of tens of minutes (arbitrary units normalized to t0, n = 3). t0 was significantly different from t5 (t test, P < 0.001). (E) Mean fluorescence in isolated dendrites from 6 experiments, 63 dendrites in total, including those in D (DHPG added at t0). Arrowhead = 7 min 14 s. t15 was significantly greater than t−2.5 (t test, P < 0.05).
Figure 2
Figure 2
Translation inhibitors anisomycin and emetine attenuated DHPG-stimulated fluorescence in isolated dendrites. (A) After transfection with GFP mRNA, isolated dendrites were incubated with 10 μg/ml of anisomycin (Δ; triangles) or control DMSO carrier () and stimulated with DHPG at t0, as in Fig. 1. (B) The same experiment with 1 μg/ml of emetine (⊗; circles) and control ethanol carrier (). n = 4. At t10, fluorescence in inhibitor-treated dendrites was significantly less than controls (t test, P < 0.05).
Figure 3
Figure 3
Transfection of intact hippocampal neurons with GFP mRNA resulted in fluorescence in cell bodies as well as dendrites. (A) Transmission image of cultured hippocampal neurons transfected with GFP mRNA by lipofection. Dashed box indicates region shown in BD. Solid box indicates dendrite shown in F. (B) MPLSM fluorescence image of neurons within dashed box in A. [Bar = 100 μm.] (C) Fluorescence image of neurons in B after stimulation with 20 μM DHPG for 27 min 30 s. (D) Fluorescence image of neurons in B after stimulation with 20 μM DHPG for 37 min 30 s. Fluorescence appears in cell bodies as well as dendrites. (E) Mean fluorescence per pixel in ROIs around dendrites () and cell bodies (Δ) over a time course of tens of minutes (arbitrary units normalized to t0, n = 3). Small capital letters B, C, and D on the graph depict time points for images BD. Translation was exponential in dendrites and linear in cell bodies. (F) Enlarged fluorescent images of example dendrite (solid box in A). [Bar = 10 μm.] Numbers indicate minutes of stimulation with 20 μM DHPG. Fluorescent puncta were spatially stable (highlighted by vertical dashed gray lines) over a time course of tens of minutes.
Figure 4
Figure 4
DHPG-stimulated synthesis of GFP protein at specific sites along isolated dendrites. (A) Enlarged images of dendrite from black box in Fig. 1B during time course [(5-min intervals) Bar = 50 μm.] showing example hotspots analyzed in B and C. (B) Profile plots through reoriented images of dendrite displayed in A, as examples of hotspots analyzed in D. (Inset) Line of the profile plot across hotspots. Fluorescence range 0–255: 0 = black, 255 = saturated. (C) Examples of hotspots analyzed in D. (Inset) ROIs (white circles) were applied to fluorescent hotspots, and the mean fluorescence intensity per pixel in each ROI was measured across time. (Graph) Time course of hotspot fluorescence as a proportion of that at t0 (——) with exponential curves applied to hotspots 1 and 5 (- - - -). (D) Histogram of time constants for exponential curves applied to fluorescence time courses for ROIs (such as those in C) around 134 hotspots displayed in Fig. 1.
Figure 5
Figure 5
GFP hotspots colocalized with anti-ribosomal fluorescence. (A) Transmission image of isolated dendrites with black lines highlighting some larger dendrites. Black circles indicate sites of cell bodies before they were removed, and arrows show sites of example hotspots shown in B and C. One grid = 175 μm2. (B) MPLSM fluorescence images of dendrites in A after transfection with GFP mRNA and stimulation with DHPG for 7 min 30 s and 25 min. Gray circles indicate sites of cell bodies before they were removed, and arrows show example hotspots corresponding to those in C. (C) Confocal image of fluorescent dendrites from B that were fixed and counterstained with monoclonal anti-ribosomal Ab (red). Some red puncta appeared devoid of green fluorescence (arrowheads), but all green hotspots contained some red anti-ribosomal fluorescence (examples shown by arrows). [Bar = 100 μm.] (D) Example of an intact neuron stained under the same procedure as isolated dendrites in B and C. (Upper) Transmission image of neuron on gridded coverslip. One grid = 175 μm2. (Lower) Confocal image of green GFP fluorescence and red anti-ribosomal fluorescence. Intact dendrites showed the same fluorescence pattern as isolated dendrites in C. (E) Example of an isolated dendrite counterstained with tetramethylrhodamine B isothiocyanate (TRITC)-phalloidin (indicative of F-actin) under the same procedure as isolated dendrites in B and C (i.e., fluorescence pattern comparison using a protein not associated with translation). (Top) Transmission image of neuron on gridded coverslip before removal of cell body. (Middle) Transmission image of isolated dendrite after removal of the cell body. One grid = 175 μm2. (Bottom) Confocal image of green GFP fluorescence and red TRITC-phalloidin fluorescence. Arrow shows sever-point where cell body was removed. Many GFP hotspots did not contain red fluorescence; the pattern of fluorescence was different from the anti-ribosomal staining in C and D.
Figure 6
Figure 6
Greater anti-ribosomal fluorescence was associated with GFP hotspots that exhibited “fast” translation. (A) Histogram of time constants for all GFP hotpots within isolated dendrites shown in Fig. 5B (as calculated in Fig. 4C). Bar indicates region of histogram shown in B. (B) Mean intensity per pixel red anti-ribosomal fluorescence (Upper) found in GFP hotspots whose time constants are expressed in the histogram (Lower). Fluorescence range 0–255: 0 = black, 255 = saturated. Red fluorescence found in GFP hotspots with time constants between 30 s and 1 min was significantly greater than in hotspots with time constants between 3 min and 3 min 30 s (P < 0.05). Dashed lines are Gaussian curves. Greater ribosomal density at sites of fast translation is consistent with efficient recruitment of 40 S and 60 S ribosomal subunits as part of initiation, the first step of translation.

References

    1. Torre E R, Steward O. J Neurosci. 1996;16:5967–5978. - PMC - PubMed
    1. Estee Kacharmina J, Job C, Crino P, Eberwine J. Proc Natl Acad Sci USA. 2000;97:11545–11550. - PMC - PubMed
    1. Crino P B, Eberwine J. Neuron. 1996;17:1173–1187. - PubMed
    1. Aakalu G, Smith W B, Nguyen N, Jiang C, Schuman E M. Neuron. 2001;30:489–502. - PubMed
    1. Steward O. Neuron. 1997;18:9–12. - PubMed

Publication types

LinkOut - more resources