Tree rings, carbon dioxide, and climatic change
- PMID: 11607744
- PMCID: PMC33752
- DOI: 10.1073/pnas.94.16.8350
Tree rings, carbon dioxide, and climatic change
Abstract
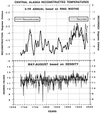
Tree rings have been used in various applications to reconstruct past climates as well as to assess the effects of recent climatic and environmental change on tree growth. In this paper we briefly review two ways that tree rings provide information about climate change and CO2: (i) in determining whether recent warming during the period of instrumental observations is unusual relative to prior centuries to millennia, and thus might be related to increasing greenhouse gases; and (ii) in evaluating whether enhanced radial growth has taken place in recent decades that appears to be unexplained by climate and might instead be due to increasing atmospheric CO2 or other nutrient fertilization. It is found that a number of tree-ring studies from temperature-sensitive settings indicate unusual recent warming, although there are also exceptions at certain sites. The present tree-ring evidence for a possible CO2 fertilization effect under natural environmental conditions appears to be very limited.
Figures

References
-
- Mitchell J F B, Johns T C, Gregory J M, Tett S F B. Nature (London) 1995;376:501–504.
-
- Jacoby G C, D’Arrigo R D. In: Biotic Feedbacks in the Global Climatic System: Will the Warming Feed the Warming? Woodwell G M, Mackenzie F T, editors. New York: Oxford Univ. Press; 1995. pp. 108–118.
-
- Woodwell G M, Mackenzie F T, editors. Biotic Feedbacks in the Global Climatic System: Will the Warming Feed the Warming? New York: Oxford Univ. Press; 1995.
-
- Ciais P, Tans P, Torlier M, White J W C, Francey R J. Science. 1995;269:1098–1102. - PubMed
-
- Denning A S, Fung I Y, Randall D. Nature (London) 1995;376:240–243.
LinkOut - more resources
Full Text Sources
Miscellaneous

