

Linear inverse source estimate of combined EEG and MEG data related to voluntary movements
- PMID: 11668651
- PMCID: PMC6871788
- DOI: 10.1002/hbm.1052
Linear inverse source estimate of combined EEG and MEG data related to voluntary movements
Abstract
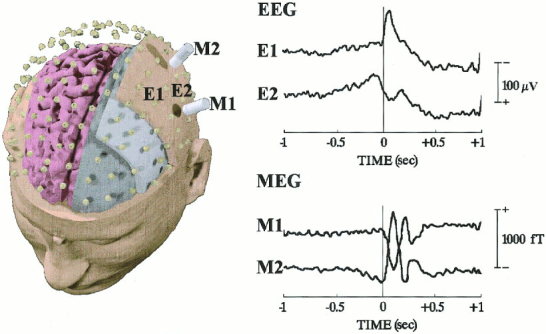
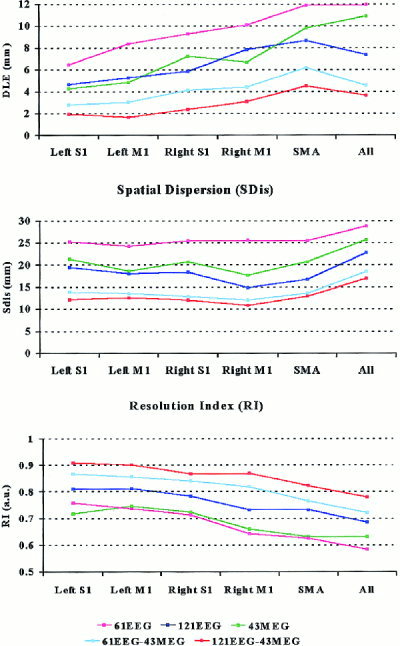
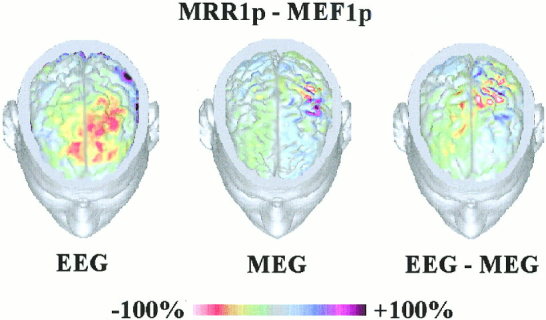
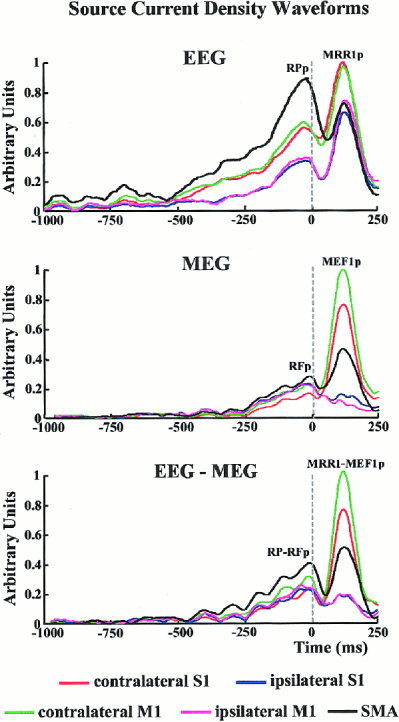
A method for the modeling of human movement-related cortical activity from combined electroencephalography (EEG) and magnetoencephalography (MEG) data is proposed. This method includes a subject's multi-compartment head model (scalp, skull, dura mater, cortex) constructed from magnetic resonance images, multi-dipole source model, and a regularized linear inverse source estimate based on boundary element mathematics. Linear inverse source estimates of cortical activity were regularized by taking into account the covariance of background EG and MEG sensor noise. EEG (121 sensors) and MEG (43 sensors) data were recorded in separate sessions whereas normal subjects executed voluntary right one-digit movements. Linear inverse source solution of EEG, MEG, and EEG-MEG data were quantitatively evaluated by using three performance indexes. The first two indexes (Dipole Localization Error [DLE] and Spatial Dispersion [SDis]) were used to compute the localization power for the source solutions obtained. Such indexes were based on the information provided by the column of the resolution matrix (i.e., impulse response). Ideal DLE values tend to zero (the source current was correctly retrieved by the procedure). In contrast, high DLE values suggest severe mislocalization in the source reconstruction. A high value of SDis at a source space point mean that such a source will be retrieved by a large area with the linear inverse source estimation. The remaining performance index assessed the quality of the source solution based on the information provided by the rows of the resolution matrix R, i.e., resolution kernels. The i-th resolution kernels of the matrix R describe how the estimation of the i-th source is distorted by the concomitant activity of all other sources. A statistically significant lower dipole localization error was observed and lower spatial dispersion in source solutions produced by combined EEG-MEG data than from EEG and MEG data considered separately (P < 0.05). These effects were not due to an increased number of sensors in the combined EEG-MEG solutions. They result from the independence of source information conveyed by the multimodal measurements. From a physiological point of view, the linear inverse source solution of EEG-MEG data suggested a contralaterally preponderant bilateral activation of primary sensorimotor cortex from the preparation to the execution of the movement. This activation was associated with that of the supplementary motor area. The activation of bilateral primary sensorimotor cortical areas was greater during the processing of afferent information related to the ongoing movement than in the preparation for the motor act. In conclusion, the linear inverse source estimate of combined MEG and EEG data improves the estimate of movement-related cortical activity.
Copyright 2001 Wiley-Liss, Inc.
Figures
References
-
- Allison T, McCarthy G, Luby M, Puce A, Spencer DD (1996): Localization of functional regions of human mesial cortex by somatosensory evoked potential recording and by cortical stimulation. Electroencephalogr Clin Neurophysiol 100: 126–140. - PubMed
-
- Babiloni F, Babiloni C, Carducci F, Fattorini L, Onorati P, Urbano A (1996): Spline Laplacian estimate of EEG potentials over a realistic magnetic resonance‐constructed scalp surface model. Electroencephalogr Clin Neurophysiol 98: 363–373. - PubMed
-
- Babiloni C, Carducci F, Pizzella V, Indovina I, Romani GL, Rossini PM, Babiloni F (1999a): Bilateral neuromagnetic activation of human primary sensorimotor cortex in preparation and execution of unilateral voluntary finger movements. Brain Res 827: 234–236. - PubMed
-
- Babiloni C, Carducci F, Cincotti F, Rossini PM, Neuper C, Pfurtscheller G, Babiloni F (1999b): Human movement‐related potentials vs desynchronization of EEG alpha rhythm: a high‐resolution EEG study. Neuroimage 10: 658–665. - PubMed
-
- Baillet S, Garnero L, Marin G, Hugonin JP (1999): Combined MEG and EEG source imaging by minimization of mutual information. IEEE Trans Biomed Eng 46: 522–534. - PubMed
MeSH terms
LinkOut - more resources
Full Text Sources
