

Comparison of the Manganese Cluster in Oxygen-Evolving Photosystem II with Distorted Cubane Manganese Compounds through X-ray Absorption Spectroscopy
- PMID: 11671305
- PMCID: PMC3960401
- DOI: 10.1021/ic991003j
Comparison of the Manganese Cluster in Oxygen-Evolving Photosystem II with Distorted Cubane Manganese Compounds through X-ray Absorption Spectroscopy
Abstract
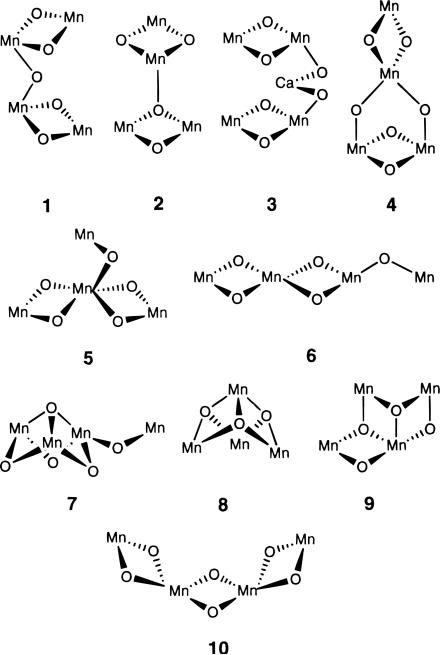
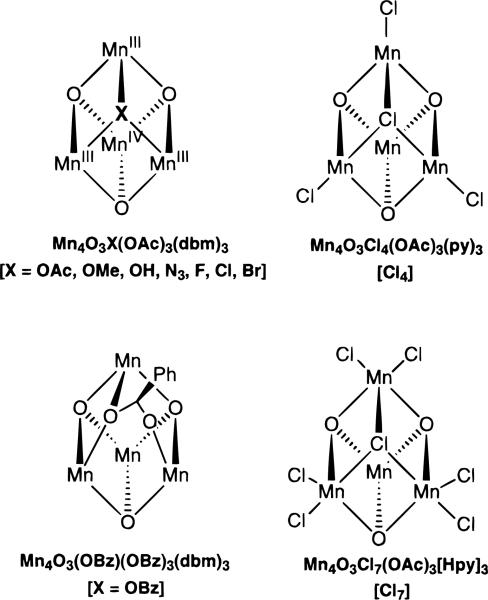
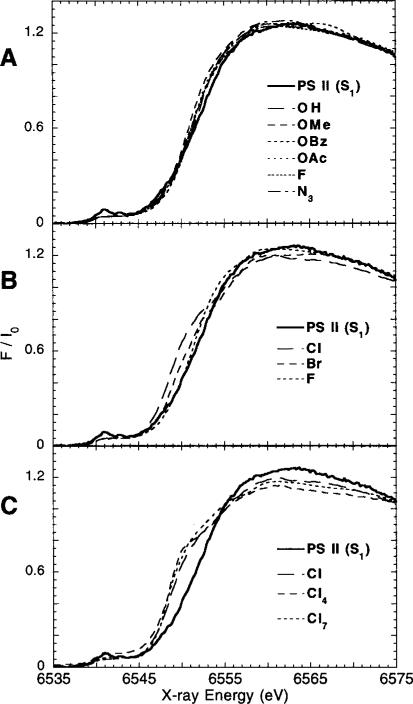
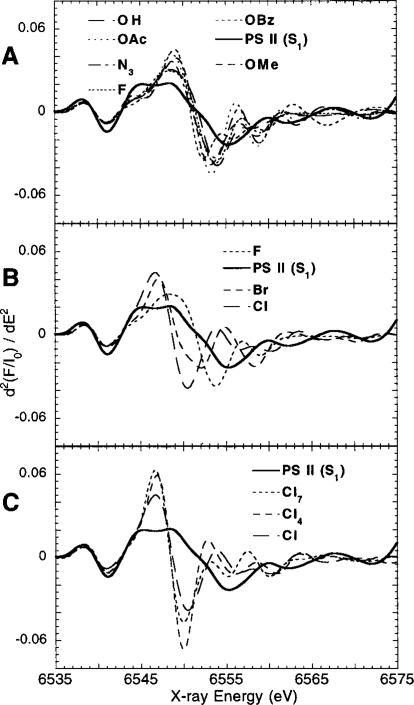
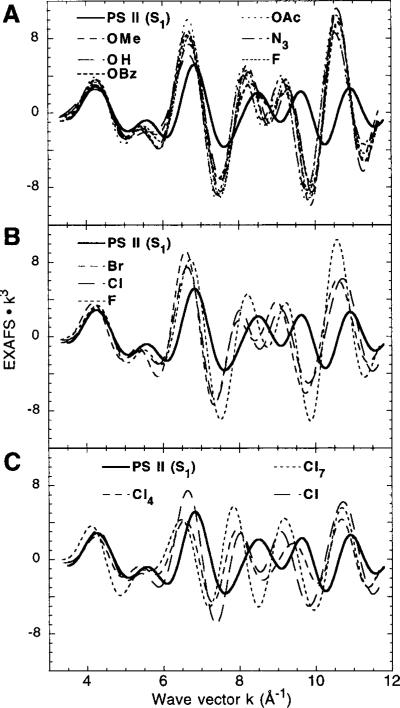
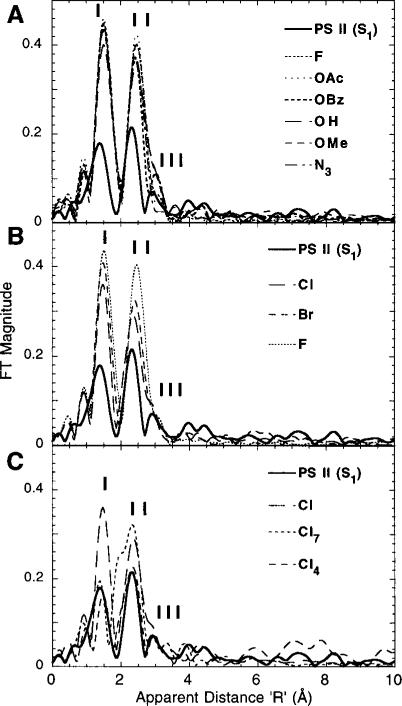
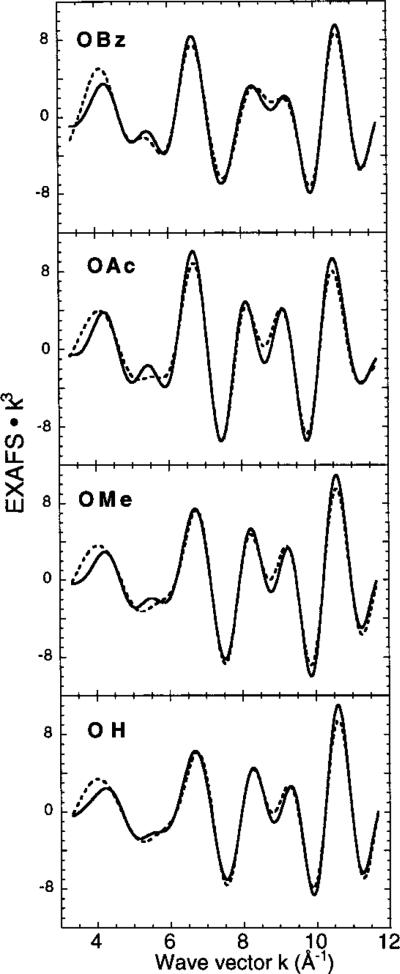
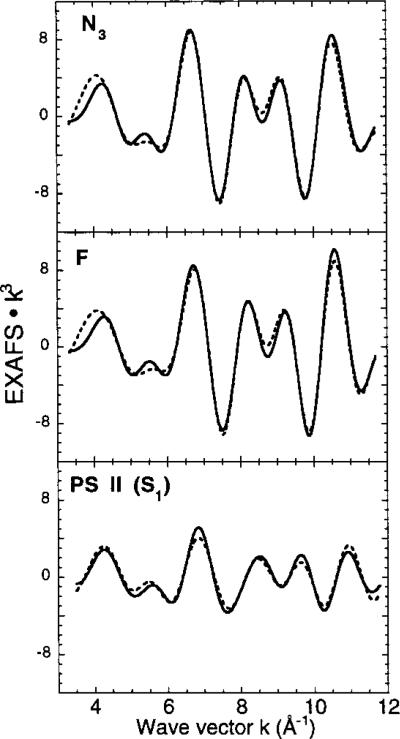
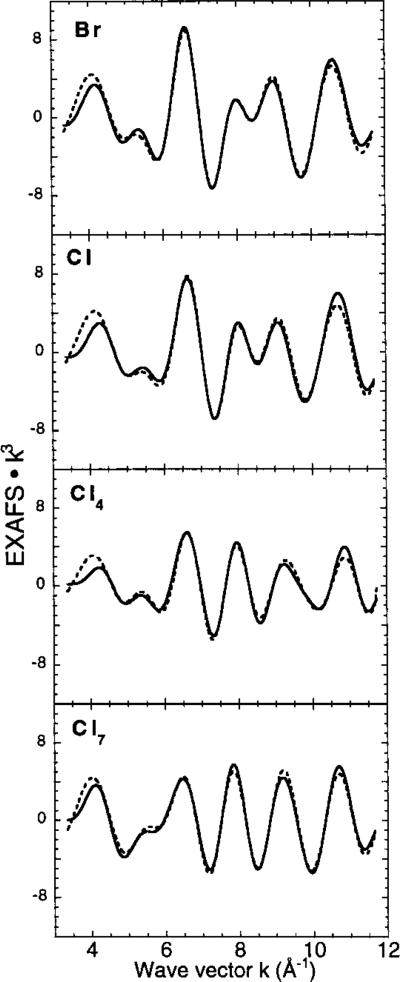
X-ray absorption spectroscopy has been employed to assess the degree of similarity between the oxygen-evolving complex (OEC) in photosystem II (PS II) and a family of synthetic manganese complexes containing the distorted cubane [Mn(4)O(3)X] core (X = benzoate, acetate, methoxide, hydroxide, azide, fluoride, chloride, or bromide). These [Mn(4)(&mgr;(3)-O)(3)(&mgr;(3)-X)] cubanes possess C(3)(v)() symmetry except for the X = benzoate species, which is slightly more distorted with only C(s)() symmetry. In addition, Mn(4)O(3)Cl complexes containing three or six terminal Cl ligands at three of the Mn were included in this study. The Mn K-edge X-ray absorption near edge structure (XANES) from the oxygen-ligated complexes begin to resemble general features of the PS II (S(1) state) spectrum, although the second derivatives are distinct from those in PS II. The extended X-ray absorption fine structure (EXAFS) of these Mn compounds also displays superficial resemblance to that of PS II, but major differences emerge on closer examination of the phases and amplitudes. The most obvious distinction is the smaller magnitude of the Fourier transform (FT) of the PS II EXAFS compared to the FTs from the distorted cubanes. Curve fitting of the Mn EXAFS spectra verifies the known core structures of the Mn cubanes, and shows that the number of the crucial 2.7 and 3.3 Å Mn-Mn distances differs from that observed in the OEC. The EXAFS method detects small changes in the core structures as X is varied in this series, and serves to exclude the distorted cubane of C(3)(v)() symmetry as a topological model for the Mn catalytic cluster of the OEC. Instead, the method shows that even more distortion of the cubane framework, altering the ratio of the Mn-Mn distances, is required to resemble the Mn cluster in PS II.
Figures
Similar articles
-
The Mn cluster in the S(0) state of the oxygen-evolving complex of photosystem II studied by EXAFS spectroscopy: are there three Di-mu-oxo-bridged Mn(2) moieties in the tetranuclear Mn complex?J Am Chem Soc. 2002 Jun 26;124(25):7459-71. doi: 10.1021/ja011621a. J Am Chem Soc. 2002. PMID: 12071755 Free PMC article.
-
Chloride ligation in inorganic manganese model compounds relevant to photosystem II studied using X-ray absorption spectroscopy.J Biol Inorg Chem. 2004 Apr;9(3):247-55. doi: 10.1007/s00775-003-0520-1. Epub 2004 Feb 3. J Biol Inorg Chem. 2004. PMID: 14758524 Free PMC article.
-
Characterization of the manganese O2-evolving complex and the iron-quinone acceptor complex in photosystem II from a thermophilic cyanobacterium by electron paramagnetic resonance and X-ray absorption spectroscopy.Biochemistry. 1988 May 31;27(11):4021-31. doi: 10.1021/bi00411a019. Biochemistry. 1988. PMID: 2843222
-
The O2-Evolving Complex of Photosystem II: Recent Insights from Quantum Mechanics/Molecular Mechanics (QM/MM), Extended X-ray Absorption Fine Structure (EXAFS), and Femtosecond X-ray Crystallography Data.Acc Chem Res. 2017 Jan 17;50(1):41-48. doi: 10.1021/acs.accounts.6b00405. Epub 2016 Dec 21. Acc Chem Res. 2017. PMID: 28001034 Review.
-
S1-state Mn4Ca complex of Photosystem II exists in equilibrium between the two most-stable isomeric substates: XRD and EXAFS evidence.J Photochem Photobiol B. 2011 Jul-Aug;104(1-2):100-10. doi: 10.1016/j.jphotobiol.2011.03.002. Epub 2011 Mar 13. J Photochem Photobiol B. 2011. PMID: 21592813 Review.
Cited by
-
The Mn cluster in the S(0) state of the oxygen-evolving complex of photosystem II studied by EXAFS spectroscopy: are there three Di-mu-oxo-bridged Mn(2) moieties in the tetranuclear Mn complex?J Am Chem Soc. 2002 Jun 26;124(25):7459-71. doi: 10.1021/ja011621a. J Am Chem Soc. 2002. PMID: 12071755 Free PMC article.
-
Mn4Ca cluster in photosynthesis: where and how water is oxidized to dioxygen.Chem Rev. 2014 Apr 23;114(8):4175-205. doi: 10.1021/cr4004874. Epub 2014 Mar 31. Chem Rev. 2014. PMID: 24684576 Free PMC article. Review. No abstract available.
-
Tribute to Kenneth Sauer (1931-2022): a mentor, a role-model, and an inspiration to all in the field of photosynthesis.Photosynth Res. 2024 Dec;162(2-3):103-138. doi: 10.1007/s11120-024-01119-0. Epub 2024 Nov 13. Photosynth Res. 2024. PMID: 39535662 Free PMC article.
-
Structural changes of the oxygen-evolving complex in photosystem II during the catalytic cycle.J Biol Chem. 2013 Aug 2;288(31):22607-20. doi: 10.1074/jbc.M113.476622. Epub 2013 Jun 13. J Biol Chem. 2013. PMID: 23766513 Free PMC article.
-
Altered structure of the Mn4Ca cluster in the oxygen-evolving complex of photosystem II by a histidine ligand mutation.J Biol Chem. 2011 Mar 18;286(11):9257-67. doi: 10.1074/jbc.M110.205740. Epub 2011 Jan 13. J Biol Chem. 2011. PMID: 21233216 Free PMC article.
References
-
- Debus RJ. Biochim. Biophys. Acta. 1992;1102:269–352. - PubMed
-
- Rutherford AW, Zimmermann J-L, Boussac A. In: The Photo-systems: Structure, Function, and Molecular Biology. Barber J, editor. Elsevier B. V.; Amsterdam: 1992. pp. 179–229.
-
- Renger G. In: Bioenergetics. Gräber P, Milazzo G, editors. Birkhäuser Verlag; Basel, Switzerland: 1997. pp. 310–358.
-
- Yachandra VK, Sauer K, Klein MP. Chem. ReV. 1996;96:2927–2950. - PubMed
-
- Kok B, Forbush B, McGloin M. Photochem. Photobiol. 1970;11:457–476. - PubMed
Grants and funding
LinkOut - more resources
Full Text Sources
