Lipopolysaccharides from distinct pathogens induce different classes of immune responses in vivo
- PMID: 11673516
- PMCID: PMC3739327
- DOI: 10.4049/jimmunol.167.9.5067
Lipopolysaccharides from distinct pathogens induce different classes of immune responses in vivo
Abstract
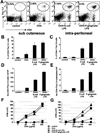
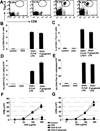
The adaptive immune system has evolved distinct responses against different pathogens, but the mechanism(s) by which a particular response is initiated is poorly understood. In this study, we investigated the type of Ag-specific CD4(+) Th and CD8(+) T cell responses elicited in vivo, in response to soluble OVA, coinjected with LPS from two different pathogens. We used Escherichia coli LPS, which signals through Toll-like receptor 4 (TLR4) and LPS from the oral pathogen Porphyromonas gingivalis, which does not appear to require TLR4 for signaling. Coinjections of E. coli LPS + OVA or P. gingivalis LPS + OVA induced similar clonal expansions of OVA-specific CD4(+) and CD8(+) T cells, but strikingly different cytokine profiles. E. coli LPS induced a Th1-like response with abundant IFN-gamma, but little or no IL-4, IL-13, and IL-5. In contrast, P. gingivalis LPS induced Th and T cell responses characterized by significant levels of IL-13, IL-5, and IL-10, but lower levels of IFN-gamma. Consistent with these results, E. coli LPS induced IL-12(p70) in the CD8alpha(+) dendritic cell (DC) subset, while P. gingivalis LPS did not. Both LPS, however, activated the two DC subsets to up-regulate costimulatory molecules and produce IL-6 and TNF-alpha. Interestingly, these LPS appeared to have differences in their ability to signal through TLR4; proliferation of splenocytes and cytokine secretion by splenocytes or DCs from TLR4-deficient C3H/HeJ mice were greatly impaired in response to E. coli LPS, but not P. gingivalis LPS. Therefore, LPS from different bacteria activate DC subsets to produce different cytokines, and induce distinct types of adaptive immunity in vivo.
Figures


Similar articles
-
A Toll-like receptor 2 ligand stimulates Th2 responses in vivo, via induction of extracellular signal-regulated kinase mitogen-activated protein kinase and c-Fos in dendritic cells.J Immunol. 2004 Apr 15;172(8):4733-43. doi: 10.4049/jimmunol.172.8.4733. J Immunol. 2004. PMID: 15067049
-
Differential induction of endotoxin tolerance by lipopolysaccharides derived from Porphyromonas gingivalis and Escherichia coli.J Immunol. 2001 Nov 1;167(9):5278-85. doi: 10.4049/jimmunol.167.9.5278. J Immunol. 2001. PMID: 11673543
-
Endotoxin-induced maturation of MyD88-deficient dendritic cells.J Immunol. 2001 May 1;166(9):5688-94. doi: 10.4049/jimmunol.166.9.5688. J Immunol. 2001. PMID: 11313410
-
Regulation of interleukin-12/interleukin-23 production and the T-helper 17 response in humans.Immunol Rev. 2008 Dec;226:112-31. doi: 10.1111/j.1600-065X.2008.00700.x. Immunol Rev. 2008. PMID: 19161420 Free PMC article. Review.
-
Understanding how lipopolysaccharide impacts CD4 T-cell immunity.Crit Rev Immunol. 2008;28(4):281-99. doi: 10.1615/critrevimmunol.v28.i4.20. Crit Rev Immunol. 2008. PMID: 19166381 Free PMC article. Review.
Cited by
-
Improved ex vivo method for microbiocidal activity across vertebrate species.Biol Open. 2012 May 15;1(5):482-7. doi: 10.1242/bio.2012919. Epub 2012 Apr 11. Biol Open. 2012. PMID: 23213440 Free PMC article.
-
Qualitatively distinct patterns of cytokines are released by human dendritic cells in response to different pathogens.Immunology. 2005 Oct;116(2):245-54. doi: 10.1111/j.1365-2567.2005.02218.x. Immunology. 2005. PMID: 16162273 Free PMC article.
-
Innate immunogenetics: a tool for exploring new frontiers of host defence.Lancet Infect Dis. 2007 Aug;7(8):531-42. doi: 10.1016/S1473-3099(07)70185-8. Lancet Infect Dis. 2007. PMID: 17646026 Free PMC article. Review.
-
TLR ligands up-regulate Trex1 expression in murine conventional dendritic cells through type I Interferon and NF-κB-dependent signaling pathways.J Leukoc Biol. 2014 Jul;96(1):93-103. doi: 10.1189/jlb.2A0713-393RR. Epub 2014 Mar 5. J Leukoc Biol. 2014. PMID: 24598055 Free PMC article.
-
Fundamental role of dendritic cells in inducing Th2 responses.Korean J Intern Med. 2018 May;33(3):483-489. doi: 10.3904/kjim.2016.227. Epub 2018 Mar 5. Korean J Intern Med. 2018. PMID: 29502361 Free PMC article. Review.
References
-
- Abbas AK, Janeway CA., Jr Immunology: improving on nature in the twenty-first century. Cell. 2000;100:129. - PubMed
-
- Mosmann TR, Coffman RL. TH1 and TH2 cells: different patterns of lymphokine secretion lead to different functional properties. Annu. Rev. Immunol. 1989;7:145. - PubMed
-
- Seder RA, Paul WE. Acquisition of lymphokine-producing phenotype by CD4+ T cells. Annu. Rev. Immunol. 1994;12:635. - PubMed
-
- Constant SL, Bottomly K. Induction of Th1 and Th2 CD4+ T cell responses: the alternative approaches. Annu. Rev. Immunol. 1997;15:297. - PubMed
-
- Carter LL, Swain SL. Single cell analyses of cytokine production. Curr. Opin. Immunol. 1997;9:177. - PubMed
Publication types
MeSH terms
Substances
Grants and funding
- R37 AI048638/AI/NIAID NIH HHS/United States
- R21 DE020916/DE/NIDCR NIH HHS/United States
- AI48638-01/AI/NIAID NIH HHS/United States
- R01 DK057665/DK/NIDDK NIH HHS/United States
- R56 AI048638/AI/NIAID NIH HHS/United States
- DK57665-01/DK/NIDDK NIH HHS/United States
- DE 13191/DE/NIDCR NIH HHS/United States
- R37 DK057665/DK/NIDDK NIH HHS/United States
- R01 AI048638/AI/NIAID NIH HHS/United States
- 1R21AI/DE48154-01/AI/NIAID NIH HHS/United States
- R01 DE014328/DE/NIDCR NIH HHS/United States
- P01 DE013191/DE/NIDCR NIH HHS/United States
LinkOut - more resources
Full Text Sources
Other Literature Sources
Molecular Biology Databases
Research Materials

