. 2001 Oct 23;98(22):12391-6.
doi: 10.1073/pnas.221181998.

Accumulation of cholera toxin and GM1 ganglioside in the early endosome of Niemann-Pick C1-deficient cells

Affiliations

Accumulation of cholera toxin and GM1 ganglioside in the early endosome of Niemann-Pick C1-deficient cells

Y Sugimoto et al. Proc Natl Acad Sci U S A. .

Abstract

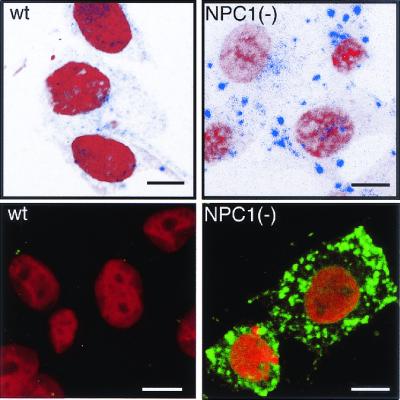
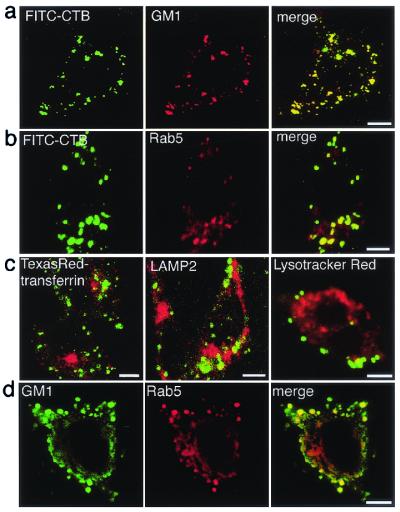
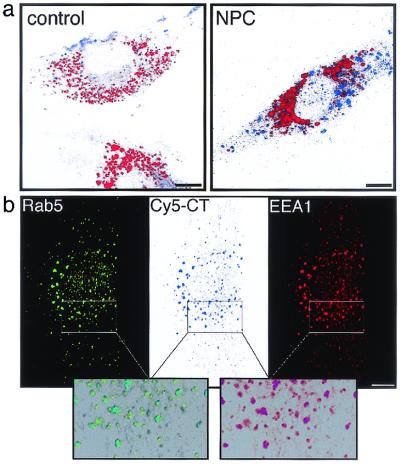
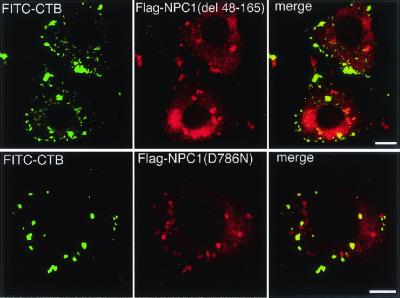
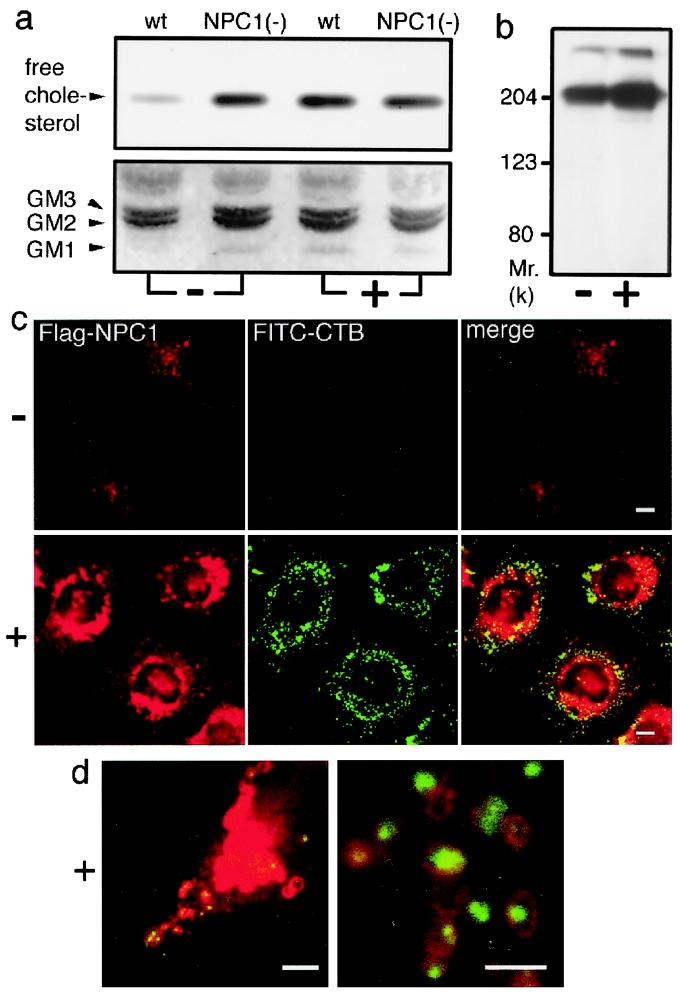
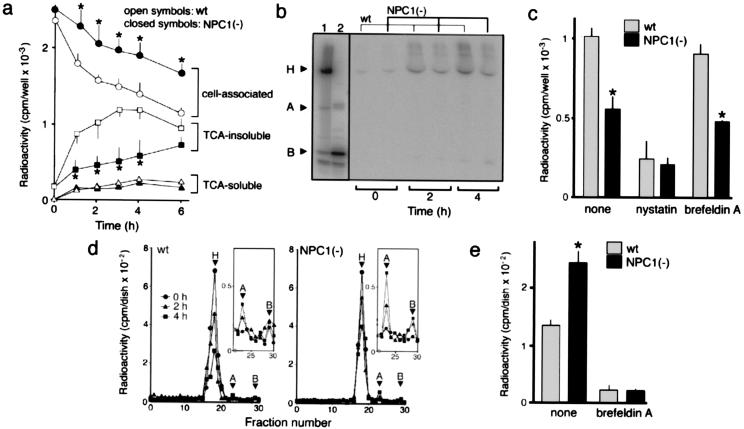
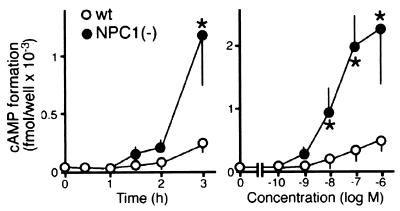
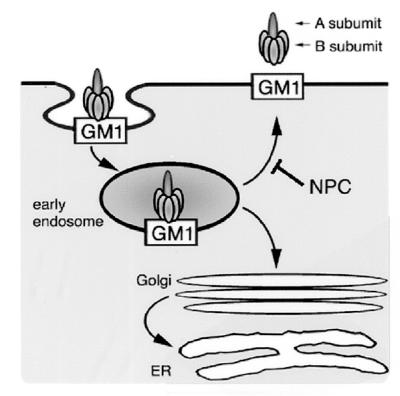
We investigated intracellular trafficking of GM1 ganglioside in Niemann-Pick C1 (NPC1)-deficient Chinese hamster ovary cells [NPC1(-) cells] by using cholera toxin (CT) as a probe. Both the holotoxin and the B subunit (CTB) accumulated in GM1-enriched intracellular vesicles of NPC1(-) cells. CTB-labeled vesicles contained the early endosome marker Rab5 but not lysosome-associated membrane protein 2 and were not labeled with either Texas red-transferrin or Lysotracker, indicating that they represent early endosomes. Similarly, CT accumulated in intracellular vesicles of human NPC fibroblasts that contained both Rab5 and early endosomal antigen 1. CTB accumulation in NPC1(-) cells was abolished by expression of wild-type NPC1 but not by mutant proteins with a mutation either in the NPC domain or the sterol-sensing domain. A part of these mutant NPC1 proteins expressed in NPC1(-) cells was localized on CTB-labeled vesicles. U18666A treatment of "knock in" cells [NPC1(-) cells that stably expressed wild-type NPC1] caused CTB accumulation similar to that in NPC1(-) cells, and a part of wild-type NPC1was localized on CTB-labeled vesicles in drug-treated cells. Finally, CT tracer experiments in NPC1(-) cells revealed retarded excretion of internalized toxin into the culture medium and an increase in the intracellular release of A subunits. In accordance with the latter result, CT was more effective in stimulating cAMP formation in NPC1(-) than in wild-type cells. These results suggest that transport of CT/GM1 complexes from the early endosome to the plasma membrane depends on the function of NPC1, whereas transport to the Golgi apparatus/endoplasmic reticulum does not.


Figures

Figure 1
Figure 1
Intracellular distribution of CT in NPC1(−) cells. Cells were incubated with Cy5-CT (Upper) or FITC-CTB (Lower), fixed, and counterstained with propidium iodide. (Bar = 10 μm.)
Figure 2
Figure 2
Intracellular localization of CT/GM1 in NPC1(−) cells. (a–c) Live cells were labeled with FITC-CTB, fixed, and then stained with the indicated antibodies, or they were simultaneously labeled with FITC-CTB and Texas red–transferrin or Lysotracker red. Only the merged images are shown in c. (d) Cells were fixed without CT-labeling and double stained with the indicated antibodies. (Bar = 10 μm.)
Figure 3
Figure 3
Intracellular localization of CT in human fibroblasts. (a) Cells from a control subject and an NPC patient, UCH, were simultaneously labeled with Cy5-CT and Lysotracker red. (b) UCH cells were labeled with Cy5-CT, fixed, and double stained with indicated antibodies. Merged images are shown (Lower). (Bar = 10 μm.)
Figure 4
Figure 4
Expression of mutant NPC1 proteins in NPC1(−) cells. Cells were transfected with expression plasmids carrying each NPC1 construct, labeled with FITC-CTB, fixed, and stained with anti-Flag. (Bar = 10 μm.)
Figure 5
Figure 5
Effects of U18666A on cellular levels of free cholesterol/GM1 and localization of NPC1. Cells were cultured with (+) or without (−) 2 μg/ml U18666A for 12 h. (a) TLC analysis of neutral (Upper) and acidic (Lower) fractions of cellular lipid extracts. Positions of standard lipids are indicated (Left). (b) Effects on the levels of Flag-NPC1. Lysates from “knock in” cells were analyzed by anti-Flag Western blotting. (c) Effects on the localization of Flag-NPC1. “Knock in” cells were labeled with FITC-CTB, fixed, and stained with anti-Flag. (Bar = 10 μm.) (d) Merged images of U18666A-treated “knock in” cells obtained at higher magnifications. (Bar = 5 μm.)
Figure 6
Figure 6
Intracellular trafficking of 125I-CT. In all experiments, cells were incubated with 10 nM 125I-CT at 4°C for 1 h, washed, and further incubated in fresh medium at 37°C for the time indicated. Cells were on six-well plates in a–c, 60-mm dishes in d, and 100-mm dishes in e. (a) Time-dependent compartmentalization of radioactivity. Each fraction were recovered as described in Materials and Methods and counted for radioactivity. (b) SDS/PAGE analysis of radioactivity released into the medium. H, A, and B indicate the positions of the holotoxin, A and B monomers. Lane 1, 125I-CT applied; lane 2, 125I-CT after boiling in reducing SDS sample buffer containing 1 mM β-mercaptoethanol. (c) Effects of nystatin and brefeldin A on the radioactivity recovered in TCA-insoluble fractions of the medium. Cells were incubated at 37°C for 2 h. In both the 4°C and 37°C incubations, the medium contained nystatin (25 μg/ml) or brefeldin A (1 μg/ml). Neither drug caused a significant change in the cell-associated radioactivity at the end of the 4°C incubation (data not shown). (d) Gel filtration chromatography of cell-associated radioactivity. The positions of the holotoxin and A and B subunits were determined from elution profiles of 125I-CT before and after boiling in reducing SDS sample buffer (not shown). Profiles of fractions 22–30 depicted in an enlarged scale (Insets) show the amounts of A subunits. (e) Effects of brefeldin A on the release of A subunits. Cells were incubated at 37°C for 4 h with or without brefeldin A treatment as in c, and the intracellular amounts of A subunits were determined by gel filtration chromatography. All in a, c, and e, each point or bar represents the mean ± SEM (n = 3). *, P < 0.05, significantly different from the values of wt cells.
Figure 7
Figure 7
Effects of CT on cAMP formation. The concentration of CT was 10 nM in time course experiments (Left), and the reaction time was 2 h in dose-response experiments (Right). Each point represents the mean ± SEM (n = 3). *, P < 0.05, significantly different from the values of wt cells.
Figure 8
Figure 8
Intracellular trafficking of CT/GM1. From the early endosome, CT/GM1 complexes take at least two pathways. First is the pathway back to the PM. Second is the pathway via the Golgi apparatus to the ER. Our findings suggest that transport back to the PM depends on the function of NPC1, whereas transport to the Golgi apparatus/ER does not. See text for details.

Similar articles

Cited by

References

    1. Carstea E D, Morris J A, Coleman K G, Loftus S K, Zhang D, Cummings C, Gu J, Rosenfeld M A, Pavan W J, et al. Science. 1997;277:228–231. - PubMed
    1. Loftus S K, Morris J A, Carstea E D, Gu J Z, Cummings C, Brown A, Ellison J, Ohno K, Rosenfeld M A, et al. Science. 1997;277:232–235. - PubMed
    1. Davies J P, Ioannou Y A. J Biol Chem. 2000;275:24367–24374. - PubMed
    1. Ioannou Y A. Mol Genet Metab. 2000;71:175–181. - PubMed
    1. Neufeld E B, Wastney M, Patel S, Suresh S, Cooney A M, Dwyer N K, Roff C F, Ohno K, Morris J A, et al. J Biol Chem. 1999;274:9627–9635. - PubMed

Publication types

MeSH terms

LinkOut - more resources