. 2001 Oct 23;98(22):12578-83.
doi: 10.1073/pnas.211195798.

Chemical inhibition of the Pho85 cyclin-dependent kinase reveals a role in the environmental stress response

Affiliations

Chemical inhibition of the Pho85 cyclin-dependent kinase reveals a role in the environmental stress response

A S Carroll et al. Proc Natl Acad Sci U S A. .

Abstract

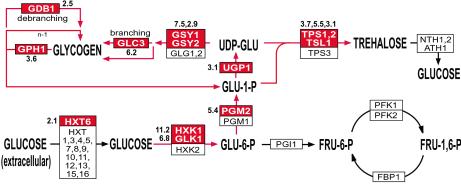
In addition to its well-established role in responding to phosphate starvation, the cyclin-dependent kinase Pho85 has been implicated in a number of other physiological responses of the budding yeast Saccharomyces cerevisiae, including synthesis of glycogen. To comprehensively characterize the range of Pho85-dependent gene expression, we used a chemical genetic approach that enabled us to control Pho85 kinase activity with a cell-permeable inhibitor and whole genome transcript profiling. We found significant phenotypic differences between the rapid loss of activity caused by inhibition and the deletion of the genomic copy of PHO85. We demonstrate that Pho85 controls the expression of not only previously identified glycogen synthetic genes, but also a significant regulon of genes involved in the cellular response to environmental stress. In addition, we show that the effects of this inhibitor are both rapid and reversible, making it well suited to the study of the behavior of dynamic signaling pathways.


Figures

Figure 1
Figure 1
Selection of inhibitor by measuring Pho4-GFP localization with static microscopy. The strains tested [EY0821 (pho85Δ), EY0825 (PHO85WT), and EY0823 (PHO85F82G)] were analyzed 15 min after treatment with inhibitor. A representative field of cells is shown for each condition. 2-NM PP1, 4-amino-1-tert-butyl-3-(2′-naphthylmethyl)pyrazolo[3,4-d]pyrimidine; 4-me PP1, 4-amino-1-tert-butyl-3-(1′-naphthyl-4′-methyl)pyrazolo[3,4-d]pyrimidine.
Figure 2
Figure 2
Analysis of Pho5 activity induced by inhibitor treatment using the liquid phosphatase assay. Units of activity were calculated by dividing the measured OD420 by the OD600 of the yeast suspension used in the assay and are displayed on the vertical axis. Time after inhibitor addition is shown on the horizontal axis. The strains and treatments shown are: EY0822 (pho85Δ) + DMSO (□); EY0824 (PHO85F82G) + 10 μM 1-Na PP1 (■), + 5 μM 1-Na PP1 (▴), + 1 μM 1-Na PP1 (crosses), + 0.5 μM 1-Na PP1 (⧫), or + DMSO (◊); and EY0826 (PHO85WT) + 10 μM 1-Na PP1 (▵). Each point shown is the mean of three independent experiments, and the error bars indicate two standard deviations.
Figure 3
Figure 3
Perfusion chamber fluorescence microscopy of Pho4-GFP localization in response to treatment with 10 μM 1-Na PP1. A single representative field of cells is shown through the course of the experiment. (A) Pretreatment. (B) After 10 min in 10 μM 1-Na PP1. (C) Five minutes after removal of 1-Na PP1. (Magnification: ×2,000.)
Figure 4
Figure 4
Summary of microarray results. (AC) Clusters of genes from larger tree containing all genes with at least one change greater than 2-fold in at least one of the experiments shown (a–l; see legend for E). Genes of interest are indicated in bold. Correlation for each node is indicated below in parentheses. (A) PHO and PHM genes (0.86) and PHM7. The PHO3 induction observed is likely caused by hybridization of PHO5 cDNA (87% identity), because PHO3 is deleted in the strains used for these studies. (B) PDR5 cluster (0.98). (C) Genes induced by 1-Na PP1 treatment (0.91; individual nodes all greater than 0.96). (D) Color key for clusters. Induction value is shown to the right of the corresponding square. A gray square indicates a missing data point. (E) Legend of the experiments shown. Experimental design is described in Materials and Methods. Experiments involving treatments with 1-Na PP1 are indicated by a light blue (1 μM) or darker blue (10 μM) shaded box. (FH) Graphs of average induction ratios for the clusters shown in AC, respectively. Treatment with 1-Na PP1 is indicated as in E.
Figure 5
Figure 5
Induction of genes involved in reserve carbohydrate metabolism by chemical inhibition of Pho85F82G. The genes encoding the enzymes for the metabolic processes are shown in boxes. Genes induced 2-fold or greater by chemical inhibition of Pho85 are shown in red boxes with the maximal inhibitor-induced fold induction shown adjacent to the box. Genes shown in white boxes did not have a greater than 2-fold change in expression level.

References

    1. Hunter T. Cell. 2000;100:113–127. - PubMed
    1. Morgan D O. Annu Rev Cell Dev Biol. 1997;13:261–291. - PubMed
    1. Mendenhall M D, Hodge A E. Microbiol Mol Biol Rev. 1998;62:1191–1243. - PMC - PubMed
    1. Uesono Y, Tanaka K, Toh-e A. Nucleic Acids Res. 1987;15:10299–10309. - PMC - PubMed
    1. Toh-e A, Tanaka K, Uesono Y, Wickner R B. Mol Gen Genet. 1988;214:162–164. - PubMed

Publication types

MeSH terms

Substances