. 2001 Oct 23;98(22):12772-7.
doi: 10.1073/pnas.201404598.

A biophysical model of bidirectional synaptic plasticity: dependence on AMPA and NMDA receptors

Affiliations

A biophysical model of bidirectional synaptic plasticity: dependence on AMPA and NMDA receptors

G C Castellani et al. Proc Natl Acad Sci U S A. .

Abstract

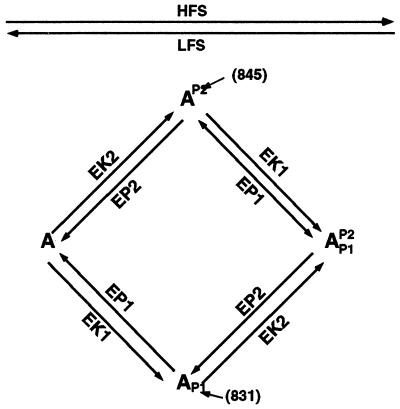
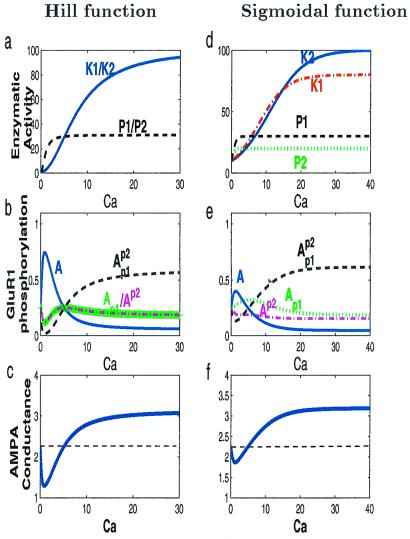
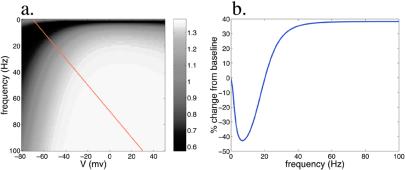
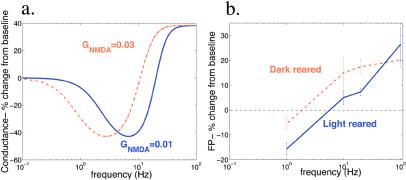
In many regions of the brain, including the mammalian cortex, the magnitude and direction of activity-dependent changes in synaptic strength depend on the frequency of presynaptic stimulation (synaptic plasticity), as well as the history of activity at those synapses (metaplasticity). We present a model of a molecular mechanism of bidirectional synaptic plasticity based on the observation that long-term synaptic potentiation (LTP) and long-term synaptic depression (LTD) correlate with the phosphorylation/dephosphorylation of sites on the alpha-amino-3-hydroxy-5-methyl-4-isoxazolepropionic acid receptor subunit protein GluR1. The primary assumption of the model, for which there is wide experimental support, is that postsynaptic calcium concentration and consequent activation of calcium-dependent protein kinases and phosphatases are the triggers for the induction of LTP/LTD. As calcium influx through the n-methyl-d-aspartate (NMDA) receptor plays a fundamental role in the induction of LTP/LTD, changes in the properties of NMDA receptor-mediated calcium influx will dramatically affect activity-dependent synaptic plasticity (metaplasticity). We demonstrate that experimentally observed metaplasticity can be accounted for by activity-dependent regulation of NMDA receptor subunit composition and function. Our model produces a frequency-dependent LTP/LTD curve with a sliding synaptic modification threshold similar to what has been proposed theoretically by Bienenstock, Cooper, and Munro and observed experimentally.


Figures

Figure 1
Figure 1
An idealized model for the cycle of GluR1 phosphorylation/dephosphorylation at two sites. The model assumes two specific kinases (EK1, EK2) and two opposing specific phosphatases (EP1, EP2). It is assumed that high-frequency stimulation preferentially stimulates the activity of protein kinases, resulting in GluR1 phosphorylation, whereas low-frequency stimulation preferentially stimulates the activity of protein phosphatases, resulting in GluR1 dephosphorylation.
Figure 2
Figure 2
Robustness of results of the mass-action approach to Ca2+-dependent enzymatic reactions, which regulate GluR1 phosphorylation and AMPAR conductance. (a) The kinase-phosphatase activity is assumed to be a Hill function of Ca, with exponent 2. EP1(Ca) = EP2(Ca) = 1 + 30(Ca)2/(1 + (Ca)2) and EK1(Ca) = EK2(Ca) = 1 + 100(Ca)2/(82 + (Ca)2). (b) Phosphorylation of GluR1 as a function of Ca2+, using the enzymatic activity assumed in a. (c) Conductance of AMPAR (in arbitrary units) as a function of calcium. At moderate calcium levels, LTD is attained, whereas at higher calcium levels, LTP is induced. (d) The kinase phosphatase activity of each enzyme in which a sigmoidal dependence on Ca is assumed: EP1 = (10⋅30)/(10 + 20⋅e−(2⋅Ca)), EP2 = (10⋅20)/(10 + 10⋅e−(2.5⋅Ca)), EK1 = 10·100/(10 + 90⋅e−(0.2⋅Ca)), EK2 = 10·80/(10 + 70⋅e−(0.25⋅Ca)). (e) Phosphorylation of GluR1 as a function of Ca2+, using the enzymatic activity assumed in d. (f) Conductance of AMPAR (in arbitrary units) as a function of calcium. Calcium and AMPA conductance are in arbitrary units.
Figure 3
Figure 3
Synaptic strength, measured as AMPAR conductance depicted as a function of presynaptic stimulation frequency (f) and postsynaptic membrane voltage (V). (a) A two-dimensional plot depicting postsynaptic membrane potential as a function of presynaptic stimulation frequency. The grey scale indicates the conductance level of the AMPAR. At low stimulation frequencies and postsynaptic voltages, the conductance is below baseline, defined as f = 0, V = −100. The diagonal line indicates a linear fV relation, which we assume to extract the results in b. (b) AMPAR conductance as a function of presynaptic stimulation frequency, where a linear dependence of V on f is assumed (as shown in a). Low-frequency stimulation induces LTD, whereas high-frequency stimulation induces LTP.
Figure 4
Figure 4
The effect of changing NMDAR subunit composition on the shape of the LTP/LTD curve. (a) We use here the same approach as in Fig. 3 to produce an LTP/LTD curve as a function of frequency. The two curves reflect two different conductance levels GNMDA = 0.01 and GNMDA = 0.03. NMDAR conductance level could change as a function of NMDAR subunit composition. We used a semi-log plot to facilitate comparison to experimental results. (b) Results reproduced from Kirkwood et al. (13), in which LTP/LTD curves of light- and dark-reared animals are compared. Notice that these two sets of results are qualitatively consistent.

References

    1. Bliss T V P, Lømo T. J Physiol (London) 1973;232:331–356. - PMC - PubMed
    1. Wigstrom H, Gustafsson B. J Physiol (Paris) 1986;81:228–236. - PubMed
    1. Dudek S M, Bear M F. Proc Natl Acad Sci USA. 1992;89:4363–4367. - PMC - PubMed
    1. Davies S N, Lester R A, Reymann K G, Collingridge G L. Nature (London) 1989;338:500–550. - PubMed
    1. Oliet S H, Malenka R C, Nicoll R A. Science. 1996;271:1294–1297. - PubMed

Publication types