. 2001 Nov;39(11):3927-37.
doi: 10.1128/JCM.39.11.3927-3937.2001.

Relative accuracy of nucleic acid amplification tests and culture in detecting Chlamydia in asymptomatic men

Affiliations

Relative accuracy of nucleic acid amplification tests and culture in detecting Chlamydia in asymptomatic men

H Cheng et al. J Clin Microbiol. 2001 Nov.

Abstract

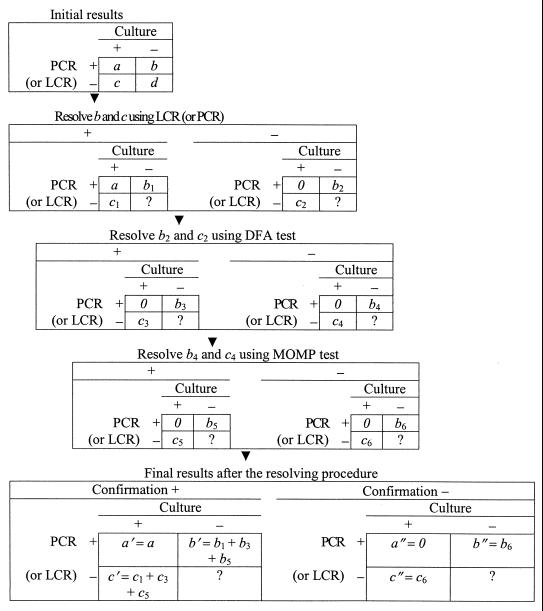
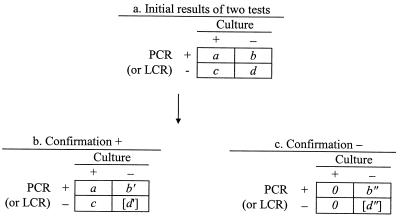
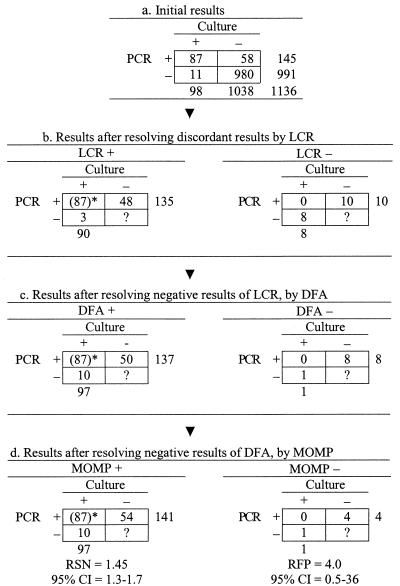
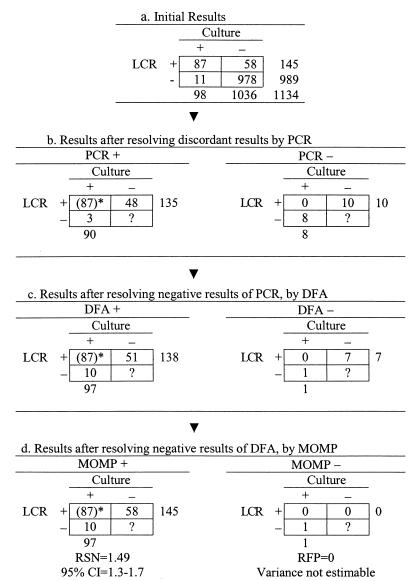
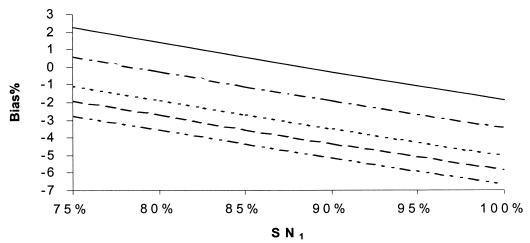
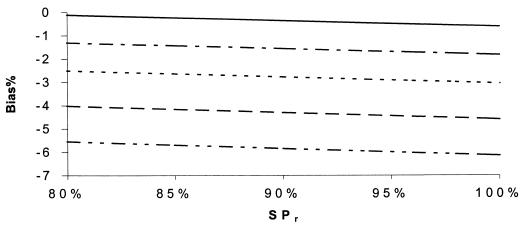
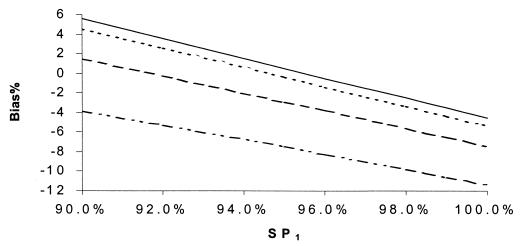
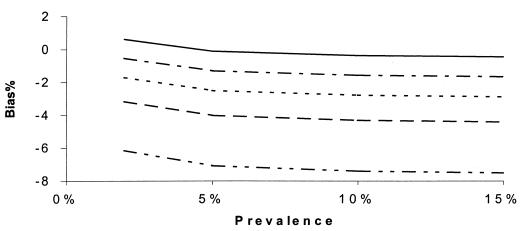
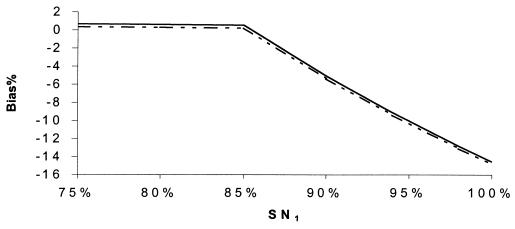
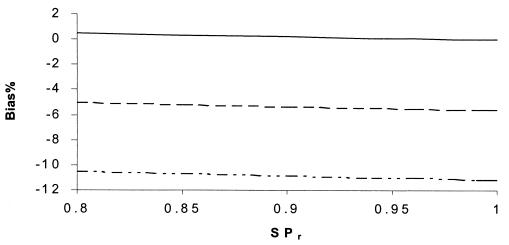
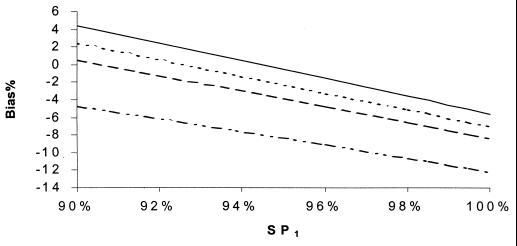
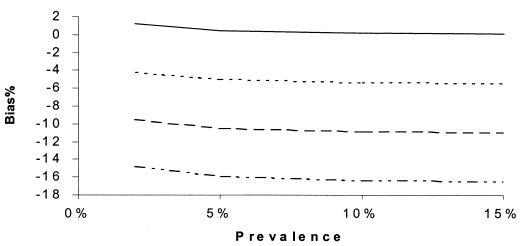
Published estimates of the sensitivity and specificity of PCR and ligase chain reaction (LCR) for detecting Chlamydia trachomatis are potentially biased because of study design limitations (confirmation of test results was limited to subjects who were PCR or LCR positive but culture negative). Relative measures of test accuracy are less prone to bias in incomplete study designs. We estimated the relative sensitivity (RSN) and relative false-positive rate (RFP) for PCR and LCR versus cell culture among 1,138 asymptomatic men and evaluated the potential bias of RSN and RFP estimates. PCR and LCR testing in urine were compared to culture of urethral specimens. Discordant results (PCR or LCR positive, but culture negative) were confirmed by using a sequence including the other DNA amplification test, direct fluorescent antibody testing, and a DNA amplification test to detect chlamydial major outer membrane protein. The RSN estimates for PCR and LCR were 1.45 (95% confidence interval [CI] = 1.3 to 1.7) and 1.49 (95% CI = 1.3 to 1.7), respectively, indicating that both methods are more sensitive than culture. Very few false-positive results were found, indicating that the specificity levels of PCR, LCR, and culture are high. The potential bias in RSN and RFP estimates were <5 and <20%, respectively. The estimation of bias is based on the most likely and probably conservative parameter settings. If the sensitivity of culture is between 60 and 65%, then the true sensitivity of PCR and LCR is between 90 and 97%. Our findings indicate that PCR and LCR are significantly more sensitive than culture, while the three tests have similar specificities.


Figures

FIG. 1
FIG. 1
Confirmation procedure in discrepant analysis.
FIG. 2
FIG. 2
Data layout of initial and confirmed results in discrepant analysis. Brackets indicate unknown value.
FIG. 3
FIG. 3
Confirmation procedure in the discrepant analysis of PCR-culture comparison. The number 87 in parentheses was positive for both PCR and cell culture and was classified as positive without resolution.
FIG. 4
FIG. 4
Confirmation procedure in the discrepant analysis of LCR-culture comparison. The number 87 in parentheses was positive for both LCR and cell culture and was classified as positive without resolution.
FIG. 5
FIG. 5
Percent bias of RSN estimates, independence. SNr = 85%, SPr = 90%, SP1 = 99%, SP2 = 99.5%, and prevalence = 10%. SN2: –··–··–··–, 55%; - - - - - - , 60%; ········, 65%; –·–·–·–, 75%; ——, 80%.
FIG. 6
FIG. 6
Percent bias of RSN estimates, independence. SN1 = 90%, SP1 = 99%, SN2 = 60%, SP2 = 99.5%, and prevalence = 10%. SNr: –··–··–··–, 80%; - - - - - - , 85%; ········, 90%; –·–·–·–, 94%; ——, 98%.
FIG. 7
FIG. 7
Percent bias of RSN estimates, independence. SNr = 85%, SPr = 90%, SN1 = 90%, SN2 = 60%, and prevalence = 10%. SP2: –··–··–··–, 95%; - - - - - - , 98%; ········, 99.5%; ——, 100%.
FIG. 8
FIG. 8
Percent bias of RSN estimates, independence. SPr = 90%, SN1 = 90%, SP1 = 99%, SN2 = 60%, and SP2 = 99.5%. SNr: –··–··–··–, 70%; - - - - - - , 85%; ········, 90%; –·–·–·–, 94%; ——, 98%.
FIG. 9
FIG. 9
Percent bias of RSN estimates according to SN1. SNs are maximum dependent, and SPs are independent. SNr = 90%, SPr = 90%, SP1 = 99%, SN2 = 60%, and prevalence = 10%. SN2: –··–··–··–, 55%; ——, 85%.
FIG. 10
FIG. 10
Percent bias of RSN estimates according to SPr. SNs are maximum dependent, and SPs are independent. SP1 = 90%, SP1 = 99%, SN2 = 60%, SP2 = 99.5%, and prevalence = 10%. SNr: –··–··–··–, 80%; - - - - - - , 85%; ——, 90 to 100%.
FIG. 11
FIG. 11
Percent bias of RSN estimates according to SP1. SNs are maximum dependent, and SPs are independent. SNr = 85%, SPr = 90%, SN1 = 90%, SN2 = 60%, and prevalence = 10%. SP2: –··–··–··–, 95%; - - - - - - , 98%; ········, 99%; ——, 100%.
FIG. 12
FIG. 12
Percent bias of RSN estimates according to prevalence. SNs are maximum dependent, and SPs are independent. SNr = 90%, SPr = 90%, SN1 = 90%, SN2 = 60%, and prevalence = 10%. SP2: –··–··–··–, 95%; - - - - - - , 98%; ········, 99%; ——, 100%.

Similar articles

Cited by

References

    1. Black C M. Current methods of laboratory diagnosis of Chlamydia trachomatis. Clin Microbiol Rev. 1997;10:160–184. - PMC - PubMed
    1. Centers for Disease Control and Prevention. Recommendations for the prevention and management of Chlamydia trachomatis infections. Morb Mortal Wkly Rep. 1993;42(RR-12):1–39. - PubMed
    1. Cheng H, Macaluso M. Comparison of the accuracy of two tests with a confirmation procedure limited to positive results. Epidemiology. 1997;8:104–106. - PubMed
    1. Cheng H, Macaluso M, Hardin M. Validity and coverage of estimates of relative accuracy. Ann Epidemiol. 2000;10:251–260. - PubMed
    1. Chernesky M A, Jang D, Lee H, Burczak J D, Hu H, Sellors J, Tomazic-Allen S J, Mahony J B. Diagnosis of Chlamydia trachomatis infections in men and women by testing first-void urine by ligase chain reaction. J Infect Dis. 1994;32:2682–2685. - PMC - PubMed

Publication types