. 2001 Nov 6;98(23):12902-7.
doi: 10.1073/pnas.231473398. Epub 2001 Oct 30.

COMPASS: a complex of proteins associated with a trithorax-related SET domain protein

Affiliations

COMPASS: a complex of proteins associated with a trithorax-related SET domain protein

T Miller et al. Proc Natl Acad Sci U S A. .

Erratum in

  • Proc Natl Acad Sci U S A 2001 Dec 18;98(26):15393-4

Abstract

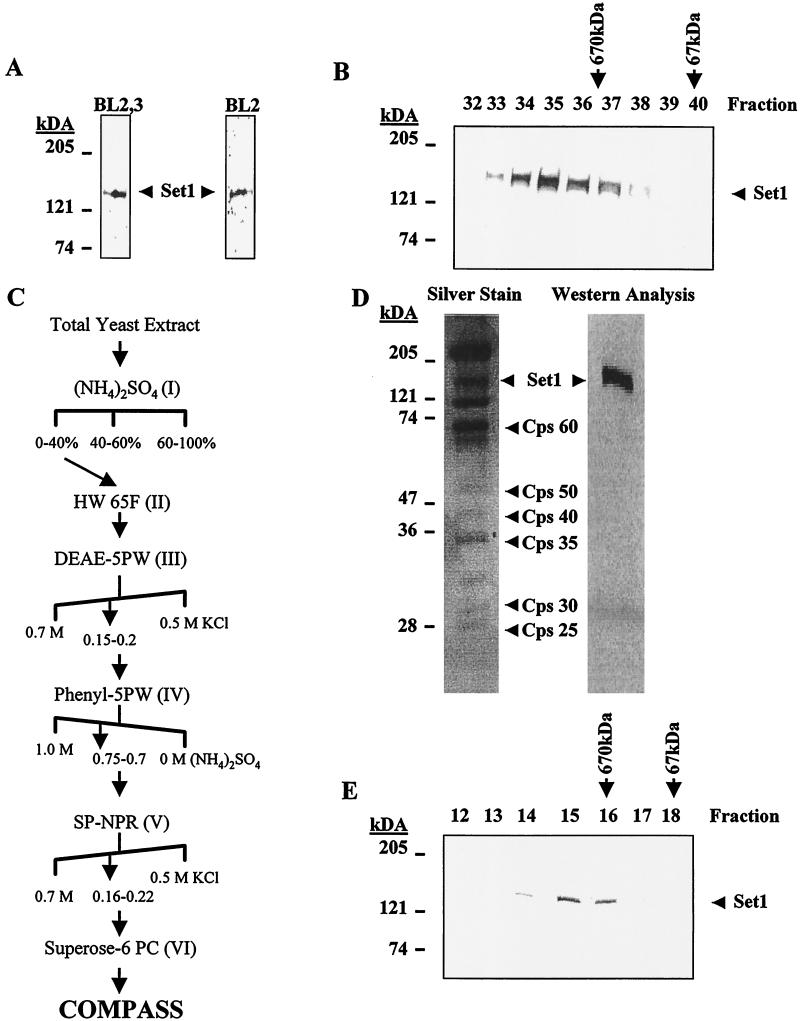
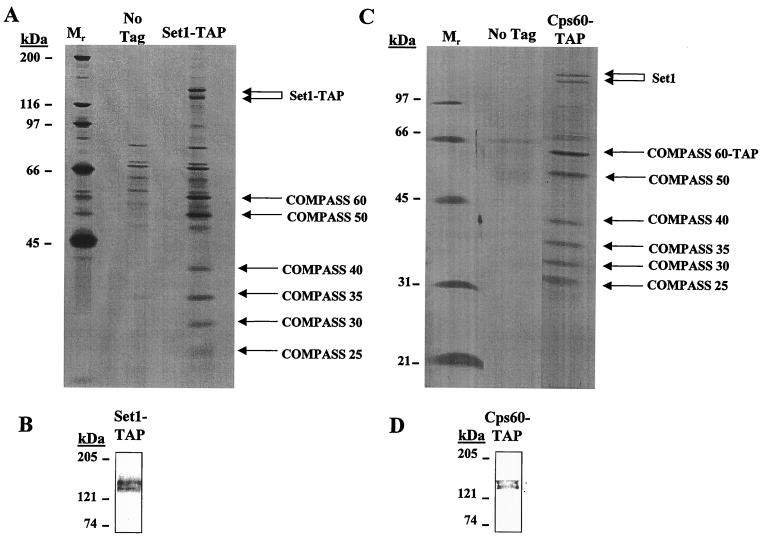
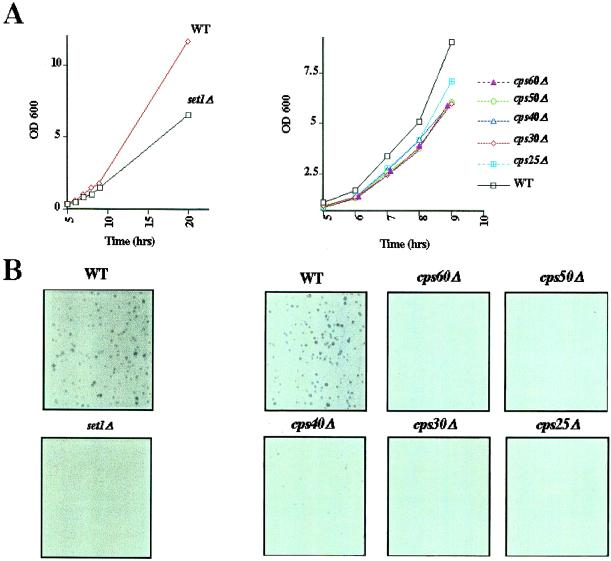
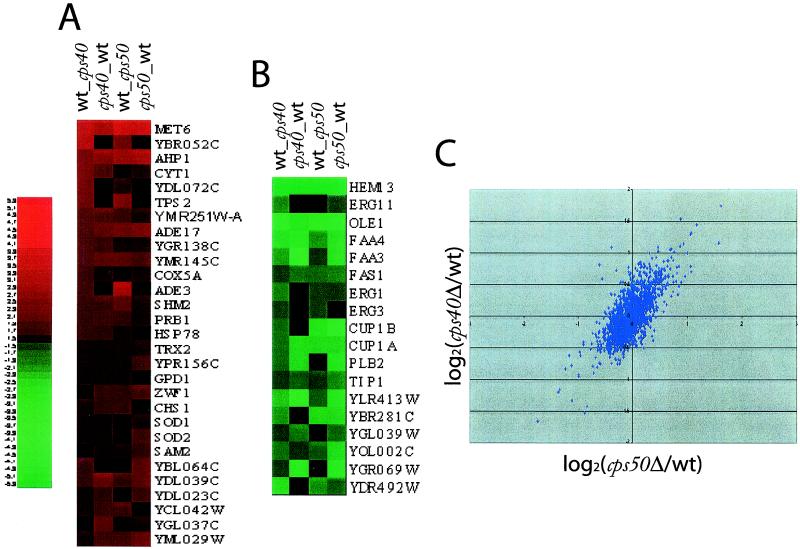
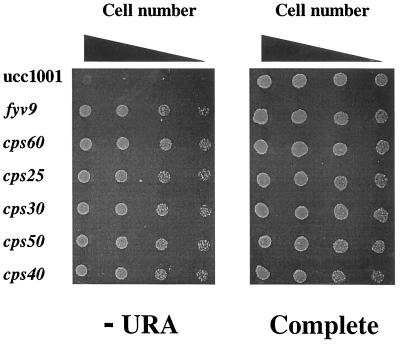
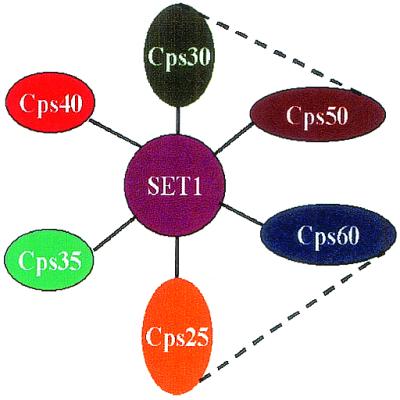
The trithorax genes encode an evolutionarily conserved family of proteins that function to maintain specific patterns of gene expression throughout cellular development. Members of this protein family contain a highly conserved 130- to 140-amino acid motif termed the SET domain. We report the purification and molecular identification of the subunits of a protein complex in the yeast Saccharomyces cerevisiae that includes the trithorax-related protein Set1. This protein complex, which we have named COMPASS (Complex Proteins Associated with Set1), consists of seven polypeptides ranging from 130 to 25 kDa. The same seven proteins were identified in COMPASS purified either by conventional biochemical chromatography or tandem-affinity tagging of the individual subunits of the complex. Null mutants missing any one of the six nonessential subunits of COMPASS grow more slowly than wild-type cells under normal conditions and demonstrate growth sensitivity to hydroxyurea. Furthermore, gene expression profiles of strains missing either of two nonessential subunits of COMPASS are altered in similar ways, suggesting these proteins have similar roles in gene expression in vivo. Molecular characterization of trithorax complexes will facilitate defining the role of this class of proteins in the regulation of gene expression and how their misregulation results in the development of human cancer.


Figures

Figure 1
Figure 1
Conventional purification of the SET1-containing complex. (A) Western analysis of yeast strain 17A1 total extracts with polyclonal anti-Set1 antibodies BL2,3 and BL2. Both antibodies immunoreacted with a single band of ≈130 kDa. (B) Western analysis of 17A1 total extracts on HW 65F size-exclusion chromatography column. Set1 complex eluted with a putative molecular mass of ≈1 MDa. (C) Chromatography scheme for the conventional biochemical purification of COMPASS: 17A1 total extract, 0–40% (NH4)2SO4, HW 65F, DEAE-5PW, Phenyl-5PW, SP-NPR, and Superose-6 PC. (D) Silver stain and Western analysis of purified COMPASS following our purification scheme. Silver stain and Western analysis of the final purified Set1 fraction indicated that Set1 copurified with six other polypeptides of ≈25, 30, 35, 40, 50, and 60 kDa. (E) Western analysis of Superose-6 PC size exclusion fractions. COMPASS eluted with a molecular mass of ≈1 MDa, indicating that no large polypeptides were lost from the COMPASS complex during the course of conventional purification.
Figure 2
Figure 2
TAP of COMPASS. (A) Silver stain analysis of TAP-tag affinity-purified Set1. Tagged Set1 copurified with six other polypeptides of ≈25, 30, 35, 40, 50, and 60 kDa, similar to the conventionally purified COMPASS. (B) Western analysis of affinity-purified tagged Set1. Anti-Set1 polyclonal antibody immunoreacted with affinity-purified Set1 tag. (C) Silver stain analysis of TAP-tag affinity-purified COMPASS 60. Tagged COMPASS 60 affinity-purified with six other polypeptides of ≈25, 30, 35, 40, 50, and 130 kDa, similar to the conventionally purified and COMPASS. (D) Western analysis of affinity-purified tagged COMPASS 60 with anti-Set1 polyclonal antibody. Set1 antibody immunoreacted with Set1 in the affinity-purified COMPASS 60 fraction.
Figure 3
Figure 3
Phenotypic characterization of cps deletion strains. (A) Slow-growth phenotype of cps and set1 deletion strains. Strains containing the indicated cps and set1 deletions were grown in liquid yeast extract peptone dextrose starting from overnight cultures. Time points indicate when an aliquot of cells was removed and the A600 nm was read. The strains harboring the COMPASS deletions are diploid strains that have both copies of the appropriate cps gene deleted. (B) Hydroxyurea sensitivity of cps deletion strains. Strains harboring the indicated cps deletions were plated from midlog growing cultures. Approximately 2,000 cells were plated onto YPD containing 100 mM hydroxyurea and grown for 2 days. Under these conditions, growth of all of the strains is similar when cells are plated in the absence of hydroxyurea (data not shown).
Figure 4
Figure 4
The effects of cps50 and cps40 deletions on gene expression are similar. (A) Genes whose mRNA levels are down-regulated [cps50 (003) and cps40 (138)] at least 1.5-fold in both COMPASS deletion strains. The black box indicates that the effect of gene expression for that point is less than 1.5-fold. (B) Genes whose mRNA levels are up-regulated at least 1.5-fold in both COMPASS deletion strains. In each case (e.g., cpsΔ_wt), the first name listed corresponds to cDNA labeled with Cy5-dCTP, and the second represents cDNA that has been labeled with Cy3-dCTP. Equal amounts of the two types of cDNA were mixed and hybridized to the same array. After normalization, the results are always expressed as cpsΔ/wt. A black box indicates that the effect of the cps deletion on gene expression is less than 1.5-fold. (C) The mRNA level for each gene in a cps deletion strain was calculated, after normalization, relative to that of the same gene in a wild-type strain. Using scatter plots in which each point represents one gene, these data were then used to graphically compare the effect of cps50 (003) deletion with the effects of cps40 (138) deletion.
Figure 5
Figure 5
Deletion of all of the subunits of COMPASS results in a defect in silencing of gene expression at telomeres. The nonessential subunits of COMPASS (CPS60, 50, 40, 30, and 25) were deleted in the URA3 telomeric reporter strain ucc1001. Five-fold serial dilutions from 5 × 10⁴ − 500 cells were applied to SD-ura (Left) and SD complete plate (Right). After 48 h, growth was compared with that of parental stain ucc1001.
Figure 6
Figure 6
The proposed structure of COMPASS. Graphic representation of COMPASS. Solid bars between the polypeptides of COMPASS are determined by either conventional or affinity purifications. The dashed bars indicate interactions determined by yeast two-hybrid.

Similar articles

Cited by

References

    1. Pirrotta V. Cell. 1998;93:333–336. - PubMed
    1. Mahmoudi T, Verrijzer C P. Oncogene. 2001;20:3055–3066. - PubMed
    1. Stassen M J, Bailey D, Nelson S, Chinwalla V, Harte P J. Mech Dev. 1995;52:209–223. - PubMed
    1. Jenuwein T, Laible G, Dorn R, Reuter G. Cell Mol Life Sci. 1998;54:80–93. - PMC - PubMed
    1. Jones R S, Gelbart W M. Mol Cell Biol. 1993;13:6357–6366. - PMC - PubMed

Publication types

MeSH terms