

The growth of malignant keratinocytes depends on signaling through the PGE(2) receptor EP1
- PMID: 11687951
- PMCID: PMC1506208
- DOI: 10.1038/sj.neo.7900182
The growth of malignant keratinocytes depends on signaling through the PGE(2) receptor EP1
Abstract
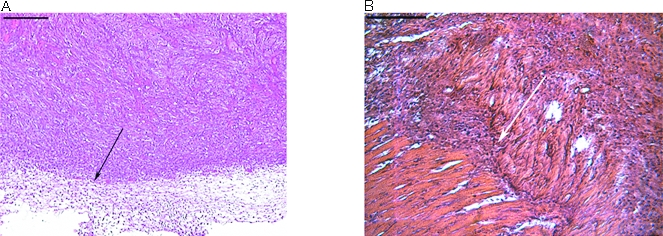
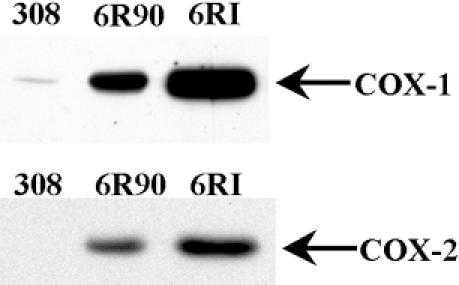
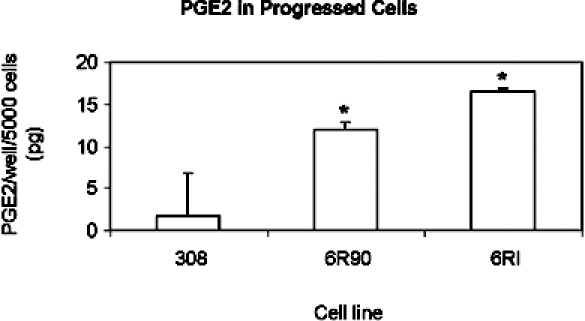
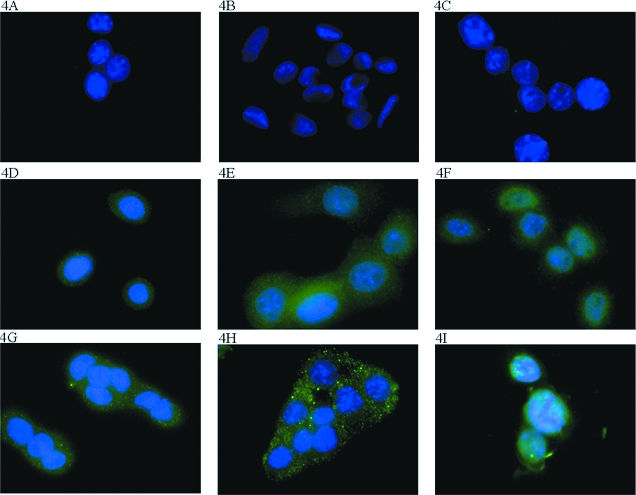
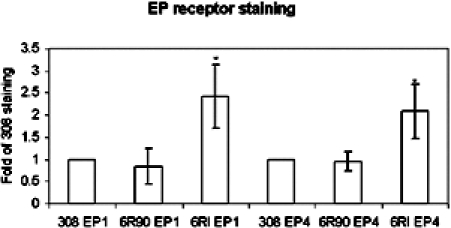
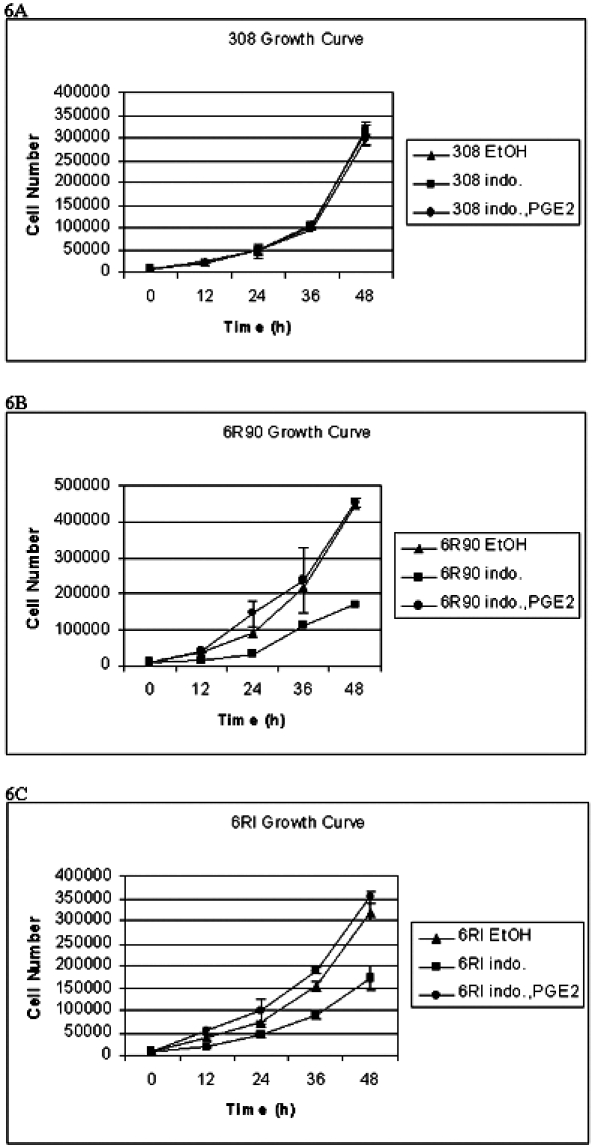
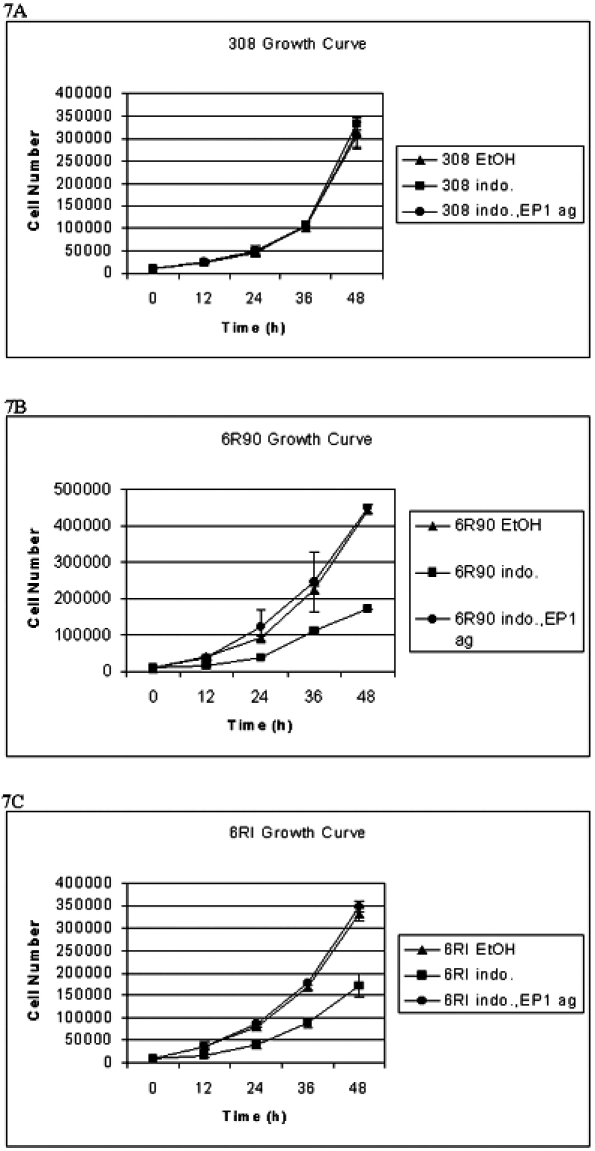
Recent discoveries shed light on the importance of prostaglandin (PG) production in the development of skin cancer. Work by Fischer et al. demonstrates that skin tumor promotion caused by ultraviolet B radiation can be decreased by up to 89% by blocking cyclooxygenase-2 (COX-2) with the drug Celecoxib. A similar study showed that Celecoxib can decrease new tumor formation by 44% in mice that already have tumors. These studies demonstrate the importance of COX-2 and PGs in the development of squamous cell carcinoma. We have explored growth signaling in a model of skin tumor progression. Because changes in PG production have been implicated in skin carcinogenesis, we examined this pathway. We found that malignant cell lines secrete more prostaglandin E(2) (PGE(2)) than the parental cells. We observed increased expression of COX-1 and -2. We also found that these cells express the PGE(2) receptors EP1 and EP4. When the cells are grown in the presence of indomethacin, the growth rate of the malignant cells is decreased. This effect can be reversed by addition of PGE(2) or an EP1 agonist to the medium. Thus, we have shown that skin tumor cells depend in part on PGE(2) signaling through the EP1 prostanoid receptor for their in vitro growth.
Figures
Similar articles
-
The role of the EP receptors for prostaglandin E2 in skin and skin cancer.Cancer Metastasis Rev. 2011 Dec;30(3-4):465-80. doi: 10.1007/s10555-011-9317-9. Cancer Metastasis Rev. 2011. PMID: 22012553 Free PMC article. Review.
-
Interleukin-1beta-induced mucin production in human airway epithelium is mediated by cyclooxygenase-2, prostaglandin E2 receptors, and cyclic AMP-protein kinase A signaling.Mol Pharmacol. 2004 Aug;66(2):337-46. doi: 10.1124/mol.66.2.337. Mol Pharmacol. 2004. PMID: 15266025
-
Colon carcinoma cell growth is associated with prostaglandin E2/EP4 receptor-evoked ERK activation.J Biol Chem. 2004 Jul 9;279(28):29797-804. doi: 10.1074/jbc.M313989200. Epub 2004 May 3. J Biol Chem. 2004. PMID: 15123663
-
Prostaglandin E2 upregulates survivin expression via the EP1 receptor in hepatocellular carcinoma cells.Life Sci. 2010 Jan 30;86(5-6):214-23. doi: 10.1016/j.lfs.2009.12.009. Epub 2009 Dec 24. Life Sci. 2010. PMID: 20035770
-
Possible cross-regulation of the E prostanoid receptors.Mol Carcinog. 2007 Aug;46(8):711-5. doi: 10.1002/mc.20347. Mol Carcinog. 2007. PMID: 17538953 Review.
Cited by
-
Cyclo-oxygenase-2 and its inhibition in cancer: is there a role?Drugs. 2007;67(6):821-45. doi: 10.2165/00003495-200767060-00001. Drugs. 2007. PMID: 17428102 Review.
-
UVB light upregulates prostaglandin synthases and prostaglandin receptors in mouse keratinocytes.Toxicol Appl Pharmacol. 2008 Oct 1;232(1):14-24. doi: 10.1016/j.taap.2008.05.017. Epub 2008 May 28. Toxicol Appl Pharmacol. 2008. PMID: 18597804 Free PMC article.
-
Voriconazole-induced photocarcinogenesis is promoted by aryl hydrocarbon receptor-dependent COX-2 upregulation.Sci Rep. 2018 Mar 22;8(1):5050. doi: 10.1038/s41598-018-23439-7. Sci Rep. 2018. PMID: 29568008 Free PMC article.
-
Molecular mechanisms of mouse skin tumor promotion.Cancers (Basel). 2010;2(2):436-82. doi: 10.3390/cancers2020436. Cancers (Basel). 2010. PMID: 21297902 Free PMC article.
-
The role of the EP receptors for prostaglandin E2 in skin and skin cancer.Cancer Metastasis Rev. 2011 Dec;30(3-4):465-80. doi: 10.1007/s10555-011-9317-9. Cancer Metastasis Rev. 2011. PMID: 22012553 Free PMC article. Review.
References
-
- Morham SG, Langenbach R, Loftin CD, Tiano HF, Vouloumanos N, Jennette JC, Mahler JF, Kluckman KD, Ledford A, Lee CA. Prostaglandin synthase 2 gene disruption causes severe renal pathology in the mouse. Cell. 1995;83:473–482. - PubMed
-
- Langenbach R, Morham SG, Tiano HF, Loftin CD, Ghanayem BI, Chulada PC, Mahler JF, Lee CA, Goulding EH, Kluckman KD. Prostaglandin synthase 1 gene disruption in mice reduces arachidonic acid-induced inflammation and indomethacin-induced gastric ulceration. Cell. 1995;83:483–492. - PubMed
-
- Tsujii M, DuBois RN. Alterations in cellular adhesion and apoptosis in epithelial cells overexpressing prostaglandin endoperoxide synthase 2. Cell. 1995;83:493–501. - PubMed
-
- Marnett LJ. Aspirin and the potential role of prostaglandins in colon cancer. Cancer Res. 1992;52:5575–5589. - PubMed
-
- Smith WL, Dewitt DL. Prostaglandin endoperoxide H synthases-1 and -2. Adv Immunol. 1996;62:167–215. - PubMed
Publication types
MeSH terms
Substances
Grants and funding
LinkOut - more resources
Full Text Sources
Other Literature Sources
Medical
Research Materials