. 2001 Nov 1;20(21):6060-70.
doi: 10.1093/emboj/20.21.6060.

Mechanism for the switch of phi29 DNA early to late transcription by regulatory protein p4 and histone-like protein p6

Affiliations

Mechanism for the switch of phi29 DNA early to late transcription by regulatory protein p4 and histone-like protein p6

A Camacho et al. EMBO J. .

Abstract

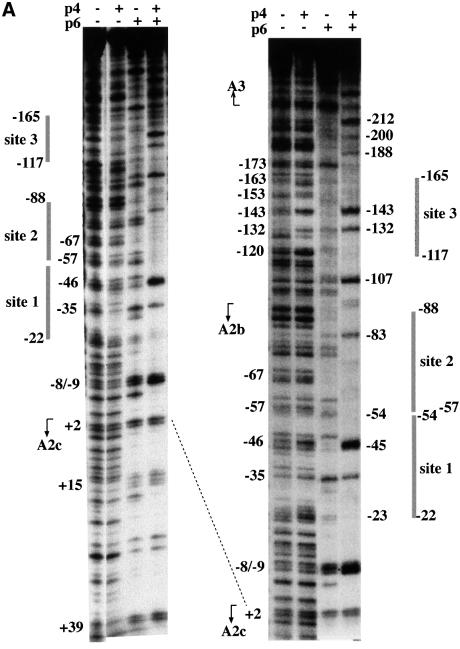
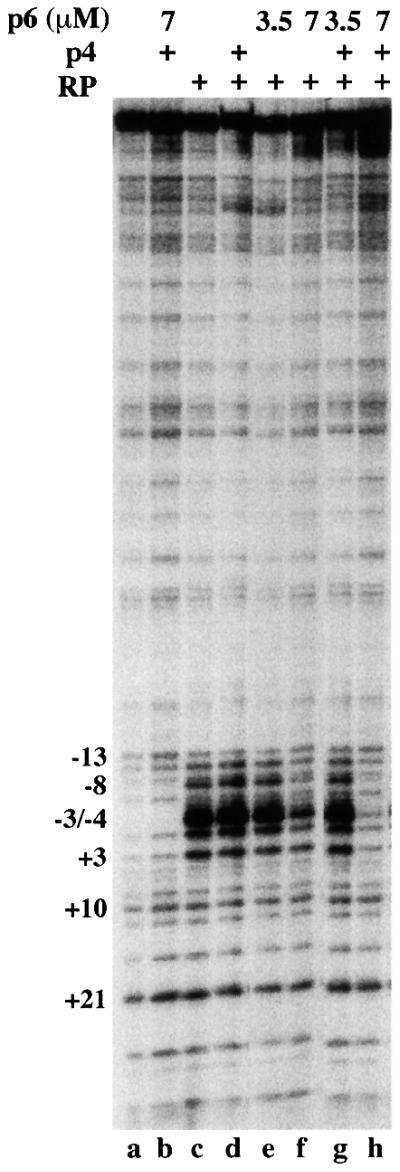
Bacteriophage phi29 gene expression takes place from four major promoters, three of them (A2b, A2c and A3) clustered within 219 bp at a central region of the genome. Transcription regulation of these promoters involves both a highly specific DNA-binding protein (p4) and a low specificity DNA-binding protein (p6) functionally related to prokaryotic histone-like proteins. Protein p6 forms extended oligomeric arrays along the phage DNA. In contrast, protein p4 binds specifically upstream of late promoter A3 and early promoter A2c. We have analysed the concomitant binding of p6 and p4 and found that the proteins cooperate with each other in the binding to the central region of the genome, resulting in a ternary p4-p6-DNA complex that affects local DNA topology. Through this complex, protein p6 exerts a direct role in the repression of promoter A2c, impeding unwinding of the DNA strands needed for open complex formation. In contrast, protein p6 functions by reinforcing the positioning of protein p4 in the repression of promoter A2b and activation of promoter A3, thereby facilitating p4-mediated transcription regulation.


Figures

None
Fig. 1. Protection of the DNA sequence containing promoters A2b, A2c and A3 by the p4–p6 nucleoprotein complex. DNase I footprint of p4 and p6 bound to the 363 bp fragment containing promoters A2b, A2c and A3, labelled either at the late strand (A) or at the early strand (B). Protein concentrations were 500 nM p4 and 7 µM p6, except in lane p4 + p6a of (B) where 3.5 µM p6 was added. Some positions relative to the start point of promoter A2c (A) or of promoter A3 (B), as well as the transcription start site for each promoter are indicated. In (C), the top lane shows the transcription and genetic map of bacteriophage φ29 with the location of promoters A1, A2c, A2b, A3 and C2 depicted. Arrows indicate direction of transcription, with the arrowheads at the termination sites (TA1 and TD1). Numbers represent genes. The phage terminal protein (TP) is shown attached to the 5′ ends of the genome. The central lane shows an enlargement of the region containing promoters A2c, A2b and A3, with the promoter elements and transcription start sites indicated for each promoter. Bottom lane: schematic representation of the data obtained from (A) (late strand) and (B) (early strand) for binding positions of proteins p4 and p6 within the multimeric nucleoprotein complex. Round balls represent protein p4 and oval balls represent protein p6, with a discontinuous outline indicating less clear-cut binding positions; triangles indicate positions for which it is not possible to ascertain whether p4 or p6 is bound. The locations of protein p4-binding sites described by Monsalve et al. (1998) and Barthelemy and Salas (1989) are shown by dashed bars 1, 2 and 3 at the sides of (A) and (B) and in (C).
None
Fig. 2. Cooperativity in the binding of p4 and p6 to fragments containing promoters A2c and/or A3. (A) A schematic representation of the fragments used in the experiment showing the promoters and promoter elements included in each fragment. Scheme b shows the DNA fragment used in (B) that includes promoters A2b, A2c and A3. Scheme c corresponds to the fragment used in (C) containing only promoter A2c, while scheme d corresponds to the fragment containing only promoter A3 used in (D). The p4 and/or p6 nucleoprotein complexes were analysed by gel electrophoresis. Proteins were added according to the scheme above the autoradiograms, where samples in lanes a–c contain 10 µM of p6 and the amount of p4 indicated, and lanes i–l contain 130 nM p4 and the amount of p6 indicated. Nucleoprotein complexes are indicated at the side.
None
Fig. 3. Binding of RNAP to the A2c, A2b and A3 promoters in the presence of proteins p4 and p6 analysed by DNase I footprinting. The DNA fragments used include promoters A2c, A2b and A3 (lanes a–p) or only promoter A2c (lanes q–ε), and were labelled at the late DNA strand. Proteins were added according to the scheme above the autoradiograms to the following final concentrations: p4 at 500 nM; RNAP at 50 nM; and p6 at 3.5, 7 or 10 µM. Guiding positions relative to the promoter A2c start site are shown at the side. Sequences protected upon RNAP binding at promoter A2c and the start sites of promoter A2b and A3 are depicted on the left. Protein p4-binding sites 1, 2 and 3 are indicated by dashed bars.
None
Fig. 4. Closed complex formation at promoter A2c in the presence of p4 and/or p6 analysed in band shift assay. Promoter A2c transcription complex was allowed to be formed at 4°C using the DNA fragment containing only promoter A2c. Proteins were added according to the scheme above the autoradiograms using 7 or 35 nM RNAP, 100 nM p4 and 7 µM p6. Complexes were resolved by electrophoresis in 4% acrylamide gels. Nucleoprotein complexes are indicated at the side.
None
Fig. 5. Simultaneous addition of p4 and p6 impedes synthesis of 12mer transcripts from promoter A2c. A truncated transcription assay was performed in the presence or absence of p4 and p6, adding the initial dinucleotide (GpU) of promoter A2c and only three (GTP, ATP and labelled UTP) of the four NTPs. Under these conditions, the only transcripts radioactively labelled should be the 12mer transcript derived from promoter A2c. The nucleotide sequence of the 12mer transcript is depicted. Template DNA is the 363 bp fragment containing promoters A2c, A2b and A3. The concentration (nM) of protein p4 used is indicated at the top of each lane and, where indicated, 7 µM p6 was added. RNAP concentration was 35 nM.
None
Fig. 6. Proteins p4 and p6 impede progression of RNAP. Progression of RNAP at promoter A2c in the absence or presence of the p4–p6 nucleoprotein complex during the synthesis of the 12mer RNA transcripts was analysed by DNase I footprinting. The initial dinucleotide (GpU) of promoter A2c and GTP, ATP and UTP were added to the assays labelled as 3NTPs. The concentrations of proteins used were: p4 at 500 nM; RNAP at 50 nM; and p6 at 7 µM. The sequence protected by RNAP before and after progression along promoter A2c is depicted on the right. Arrows mark the hypersensitive p4-derived band on the RNAP–p4 complex altered after addition of p6. Nucleotide positions relative to the start site of promoter A2c are depicted on the left.
None
Fig. 7. The p4–p6 protein complex impedes open complex formation at promoter A2c. The effect of p4 and p6 on the formation of open complex at promoter A2c was analysed by permanganate footprinting. Proteins were added according to the scheme above the autoradiogram where p4 was at 500 nM and RNAP was at 50 nM. Thymines at the promoter A2c start site are indicated.
None
Fig. 8. Binding of RNAP to promoter A3 in the presence of proteins p4 and p6 analysed by DNase I footprinting. The fragment used includes promoters A2c, A2b and A3 and was labelled at the early DNA strand. Proteins were added according to the scheme above the autoradiogram at the following final concentrations: p4 at 500 nM; RNAP at 50 nM; and p6 at 7 µM. Nucleotide positions relative to the promoter A3 start site are shown on the left. Sequences protected upon binding of RNAP are shown on the right. Dashed bars depict protein p4-binding sites 1, 2 and 3.
None
Fig. 9. Model for the switch from φ29 DNA early to late transcription due to the cooperative binding of proteins p4 and p6. (A) Upon phage infection, the host RNAP binds to promoters A2b and A2c, giving rise to transcription of genes 6 to 1 (see Figure 1), while binding to promoter A3 requires synthesis of protein p4. (B) Nucleoprotein complex of proteins p4 and p6. Binding of proteins p4 and p6 leads to the formation of a nucleoprotein complex that covers the entire DNA fragment containing promoters A2b, A2c and A3 and where binding of each protein is enhanced and becomes stabilized by the presence of the other protein. Round balls represent protein p4, oval balls represent protein p6, while triangles represent binding positions for which it was not possible to ascertain whether p4 or p6 was bound. (C) Binding of p4, p6 and RNAP to the sequence at intermediate times after phage infection. RNAP is capable of competing with molecules (dimers) of p4 and p6 bound at specific locations of promoters A2c and A3 but fails to displace them from promoter A2b. RNAP becomes stalled at promoter A2c, within the p4–p6 multimeric complex, unable to progress into open complex formation.

Similar articles

Cited by

References

    1. Adhya S., Geanacopoulos,M., Lewis,D.E., Roy,S. and Aki,T. (1998) Transcription regulation by repressosome and by RNA polymerase contact. Cold Spring Harbor Symp. Quant. Biol., 63, 1–9. - PubMed
    1. Afflerbach H., Schröder,O. and Wagner,R. (1999) Conformational changes of the upstream DNA mediated by H-NS and FIS regulate E.coli rrnB P1 promoter activity. J. Mol. Biol., 286, 339–353. - PubMed
    1. Artsimovitch I., Svetlov,V., Anthony,L., Burgess,R.R. and Landick,R. (2000) RNA polymerases from Bacillus subtilis and Escherichia coli differ in recognition of regulatory signals in vitro. J. Bacteriol., 182, 6027–6035. - PMC - PubMed
    1. Barthelemy I. and Salas,M. (1989) Characterization of a new prokaryotic transcriptional activator and its DNA recognition site. J. Mol. Biol., 208, 225–232. - PubMed
    1. Camacho A. and Salas,M. (2000) Pleiotropic effect of protein p6 on the viral cycle of bacteriophage φ29. J. Bacteriol., 182, 6927–6932. - PMC - PubMed

Publication types

MeSH terms