

doi: 10.1093/emboj/20.21.6150.
Developmental regulation of DNA replication timing at the human beta globin locus
Affiliations
- PMID: 11689454
- PMCID: PMC125288
- DOI: 10.1093/emboj/20.21.6150
Item in Clipboard
Developmental regulation of DNA replication timing at the human beta globin locus
EMBO J.
.
Abstract
The human beta globin locus replicates late in most cell types, but becomes early replicating in erythroid cells. Using FISH to map DNA replication timing around the endogenous beta globin locus and by applying a genetic approach in transgenic mice, we have demonstrated that both the late and early replication states are controlled by regulatory elements within the locus control region. These results also show that the pattern of replication timing is set up by mechanisms that work independently of gene transcription.
Figures
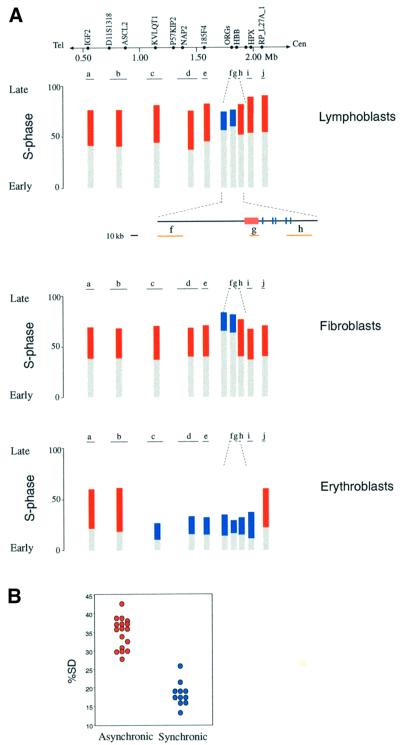
Fig. 1. Replication timing pattern in the HBB region. (A) FISH analysis was carried out on human EBV-transformed lymphoblasts, embryonic fibroblasts or peripheral blood-derived erythroblasts using a variety of different probes. In each experiment at least 100 S-phase cells (BrdU positive) were analyzed by counting SS, SD and DD patterns and then normalizing the results to the replication timing patterns of SNRPN and CD3D (see Materials and methods). For each probe, the percentage of cells with SS signals is presented as gray bars, and the percentage of cells with an SD signal as either red (asynchronous) or blue (synchronous) bars. Using this form of presentation, the amount of SS signals signifies the point in the cell cycle where the first allele replicates, while the percentage of SD signals indicates the additional movement through S phase before the second allele replicates. The results for lymphoblasts were averaged from analyses of two different cell lines. The positions of genetic markers in human chromosome region 11p15.5 and the probes (see Materials and methods for details) used in these experiments are shown on the map. The numbers indicate distances in Mb from the subtelomeric repeats. The smaller map includes details from the HBB region, with the LCR (red box), the various globin genes (blue lines) and local probes (orange). Using S-phase fractionation, we have confirmed that the two alleles of IGF2 replicate asynchronously (Simon et al., 1999), while β globin replicates synchronously in lymphoblast cells (data not shown). (B) Data (% SD) for the asynchronously replicating (28–43%) probes (red) and synchronously replicating probes (blue) from all of the cell types are shown in graphic form. Although <20% SD is considered as synchronous replication, probe i in erythroblasts (26% SD) was included in this category since it is located at the border of a synchronous domain and is still less than any of the asynchronously replicating probes. These two populations are significantly different (P <0.001) as determined by the Mann–Whitney U-test.
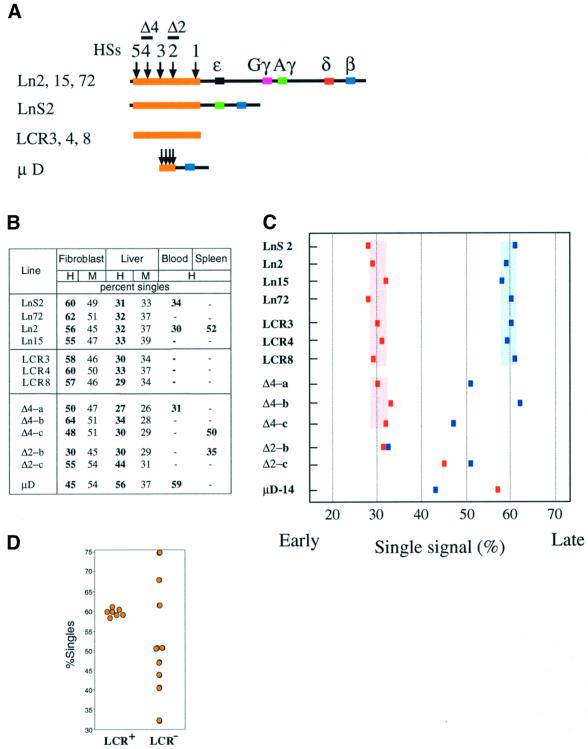
Fig. 2. Components of the LCR control replication timing. (A) Constructs used for generating the transgenic lines, showing the LCR (orange box), the five hypersensitive sites (HSs) (arrows) and the globin gene sequences (colored boxes). (B) The un-normalized times of replication (percent singlets) of the transgenic human (H) globin gene (probe 1329) and the endogenous mouse (M) globin region were determined by FISH by counting 200–300 nuclei per sample. Δ2-b, Δ2-c, Δ4-a, Δ4-b, Δ4-c and µD-14 are specific mouse lines made from the constructs shown in (A). (C) A graphic representation of transgene replication timing. All of the data are normalized to the replication values (in the same cell population) from a combination of probes (Materials and methods). The adjusted replication times in embryonic liver (red) and fibroblasts (blue) are shown for each transgenic mouse. (D) The distribution of replication timing values in non-erythroid cells for the LCR mutants (LCR–) has a large standard deviation (± 13.7), which is significantly different (P = 0.005 using Levene’s test for equality of variances) from that of the wild-type (LCR+) animals (± 1.1), whose values range from 58 to 61% singles. In addition to the transgenes shown in (B) and (C), this graph includes three additional mouse founders containing a construct carrying the globin genes without the LCR, which were also analyzed for replication timing in embryonic fibroblasts and these gave results of 40, 68 and 75% singles. Erythroid replication (28–30%) in the Δ4 series is similar (P <0.001) to that of the wild-type animals (29–32%).
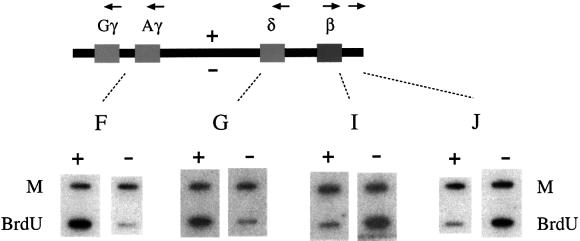
Fig. 3. Transgene replication utilizes the β globin origin. Replication direction analysis of the wild-type β-globin transgene construct in fibroblasts. Leading-strand BrdU-labeled DNA (1 µg) was prepared as described previously (Kitsberg et al., 1993b), placed on identical filters and hybridized to plus (+) or minus (–) strand riboprobes. Marker (M) DNA (1 µg) is included in every experiment to correct for differences in hybridization efficiencies of the two complementary probes. Probes F and G are on opposite sides of the presumed origin from I and J (Kitsberg et al., 1993b). In the case of I, for example, the plus probe hybridizes poorly to the BrdU DNA, but the minus probe gives a strong signal. Thus, in this region, the plus DNA represents the leading strand, and we can conclude that this fragment replicates to the right. Probe F is homologous to regions around both Gγ and Aγ. To corroborate these results we also carried out double-label FISH analysis using two cosmid probes, one covering the LCR (HG4) and the other covering the β-like genes (HG-28TK). In spleen cells from Ln2, 12% (25/210) of the nuclei showed a double HG-28TK signal together with a single HG4 signal, and only 3% (7/210) showed the opposite pattern. Similar results were obtained for erythroid cells from fetal liver (10% 20/200, 2% 4/200). These results indicate that replication in this region proceeds leftward, and this is consistent with firing at the presumed origin.
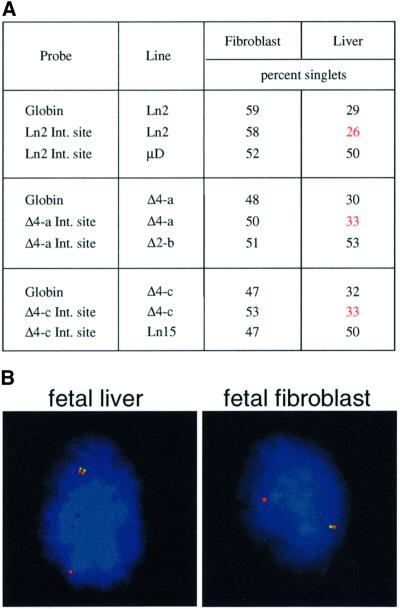
Fig. 4. Replication analysis of transgene integration sites. (A) Replication timing of the integration site on the allele carrying the transgene in mouse lines Ln2, Δ4-a and Δ4-c was scored by double labeling using probe CosHG-28TK to detect the human globin sequences. The normal replication timing of each integration site was determined on wild-type alleles using mice that do not have a transgene at this site (i.e. lines µD, Δ2-b or Ln15). The instances where the transgene alters replication timing of the integration site are highlighted in red. These data have been normalized for S-phase position as described in the legend to Figure 2. (B) Examples of BrdU-positive (blue AMCA-labeled) nuclei analyzed by FISH. The nucleus on the left is from Ln2 fetal liver. Globin is labeled with fluorescein and the integration site (probe 212a06) with rhodamine. Note that in this cell, the integration site on the transgenic allele replicates earlier (double dot) than the normal allele (single dot). The nucleus on the right is from Ln Δ4-a fibroblasts. Photomicrographs were prepared as described (Selig et al., 1992).
Similar articles
-
Analysis of the developmental and transcriptional potentiation functions of 5'HS2 of the murine beta-globin locus control region in transgenic mice.Dev Biol. 1994 Oct;165(2):574-84. doi: 10.1006/dbio.1994.1277. Dev Biol. 1994. PMID: 7958423
-
Cluster specific regulation pattern of upstream regulatory elements in human alpha- and beta-globin gene clusters.Exp Cell Res. 2008 Jan 1;314(1):115-22. doi: 10.1016/j.yexcr.2007.08.014. Epub 2007 Aug 24. Exp Cell Res. 2008. PMID: 17996867
-
Proper developmental control of human globin genes reproduced by transgenic mice containing a 160-kb BAC carrying the human beta-globin locus.Blood Cells Mol Dis. 2000 Dec;26(6):598-610. doi: 10.1006/bcmd.2000.0339. Blood Cells Mol Dis. 2000. PMID: 11358351
-
Progress toward the genetic treatment of the beta-thalassemias.Ann N Y Acad Sci. 2005;1054:78-91. doi: 10.1196/annals.1345.010. Ann N Y Acad Sci. 2005. PMID: 16339654 Review.
-
Role of intergenic human gamma-delta-globin sequences in human hemoglobin switching and reactivation of fetal hemoglobin in adult erythroid cells.Ann N Y Acad Sci. 2005;1054:48-54. doi: 10.1196/annals.1345.057. Ann N Y Acad Sci. 2005. PMID: 16339651 Review.
Cited by
-
A replicator-specific binding protein essential for site-specific initiation of DNA replication in mammalian cells.Nat Commun. 2016 Jun 8;7:11748. doi: 10.1038/ncomms11748. Nat Commun. 2016. PMID: 27272143 Free PMC article.
-
Alterations in replication timing of cancer-related genes in malignant human breast cancer cells.J Cell Biochem. 2013 May;114(5):1074-83. doi: 10.1002/jcb.24447. J Cell Biochem. 2013. PMID: 23161755 Free PMC article.
-
A multiprotein complex necessary for both transcription and DNA replication at the β-globin locus.EMBO J. 2010 Oct 6;29(19):3260-71. doi: 10.1038/emboj.2010.204. Epub 2010 Aug 31. EMBO J. 2010. PMID: 20808282 Free PMC article.
-
Control of DNA replication timing in the 3D genome.Nat Rev Mol Cell Biol. 2019 Dec;20(12):721-737. doi: 10.1038/s41580-019-0162-y. Epub 2019 Sep 2. Nat Rev Mol Cell Biol. 2019. PMID: 31477886 Free PMC article. Review.
-
Domain-wide regulation of DNA replication timing during mammalian development.Chromosome Res. 2010 Jan;18(1):127-36. doi: 10.1007/s10577-009-9100-8. Chromosome Res. 2010. PMID: 20013151 Free PMC article.
References
-
- Aladjem M.I., Groudine,M., Brody,L.L., Dieken,E.S., Fournier,R.E.K., Wahl,G.M. and Epner,E.M. (1995) Participation of human β-globin locus control region in initation of DNA replication. Science, 270, 815–819. - PubMed
-
- Aladjem M.I., Rodewald,L.W., Kolman,J.L. and Wahl,G.M. (1998) Genetic dissection of a mammalian replicator in the human β-globin locus. Science, 281, 1005–1009. - PubMed
-
- Allshire R. and Bickmore,W. (2000) Pausing for thought on the boundaries of imprinting. Cell, 102, 705–708. - PubMed
-
- Berry M., Grosveld,F. and Dillon,N. (1992) A single point mutation is the cause of the Greek form of hereditary persistence of fetal haemoglobin. Nature, 358, 499–502. - PubMed
-
- Bulger M., von Doorninck,J.H., Saitoh,N., Telling,A., Farrell,C., Bender,M.A., Felsenfeld,G., Axel,R. and Groudine,M. (1999) Conservation of sequence and structure flanking the mouse and human β-globin loci: The β-globin genes are embedded within an array of odorant receptor genes. Proc. Natl Acad. Sci. USA, 96, 5129–5134. - PMC - PubMed
Publication types
MeSH terms
Substances
LinkOut - more resources
Full Text Sources
