

Activated peripheral CD8 lymphocytes express CD4 in vivo and are targets for infection by human immunodeficiency virus type 1
- PMID: 11689637
- PMCID: PMC114742
- DOI: 10.1128/JVI.75.23.11555-11564.2001
Activated peripheral CD8 lymphocytes express CD4 in vivo and are targets for infection by human immunodeficiency virus type 1
Abstract
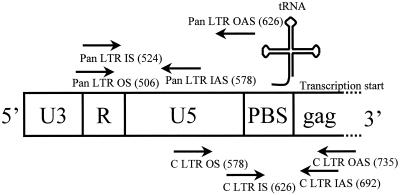
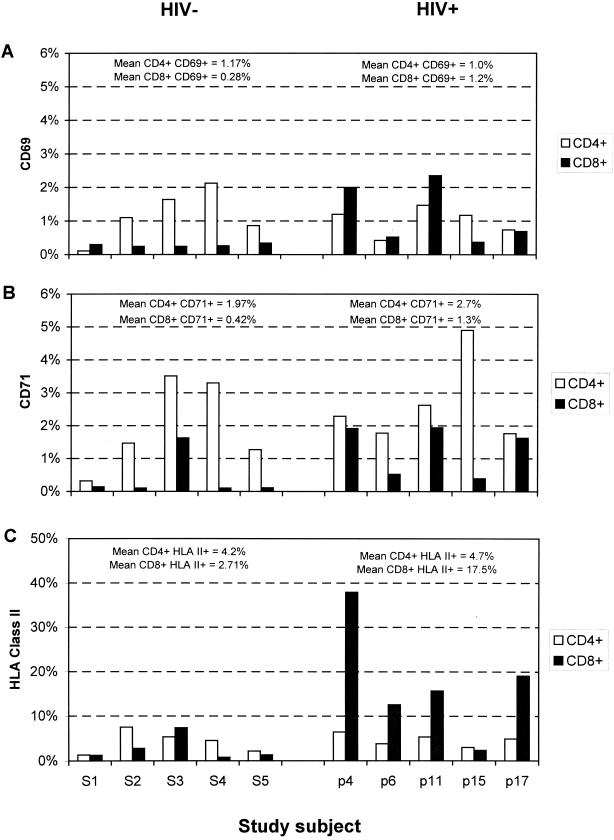
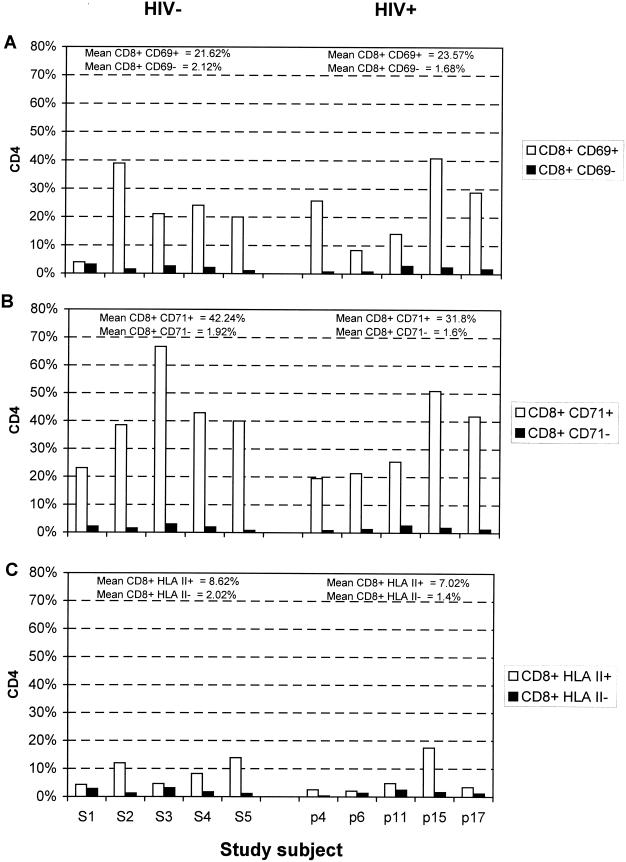
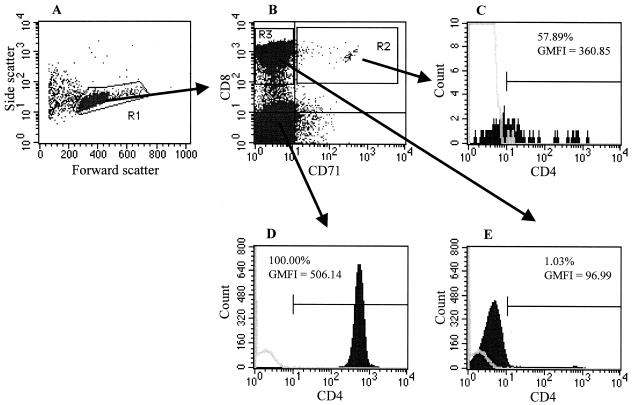
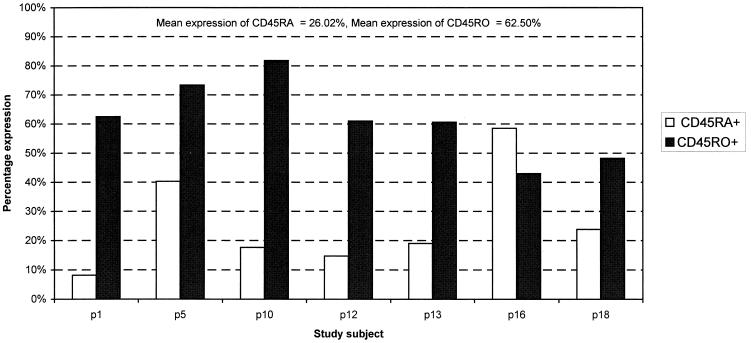
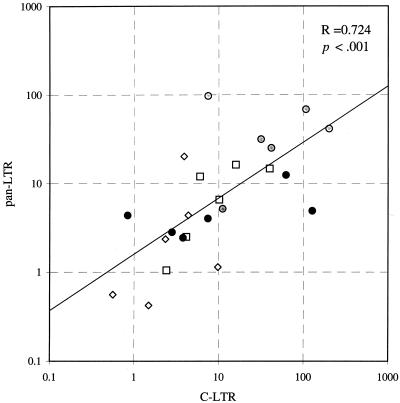
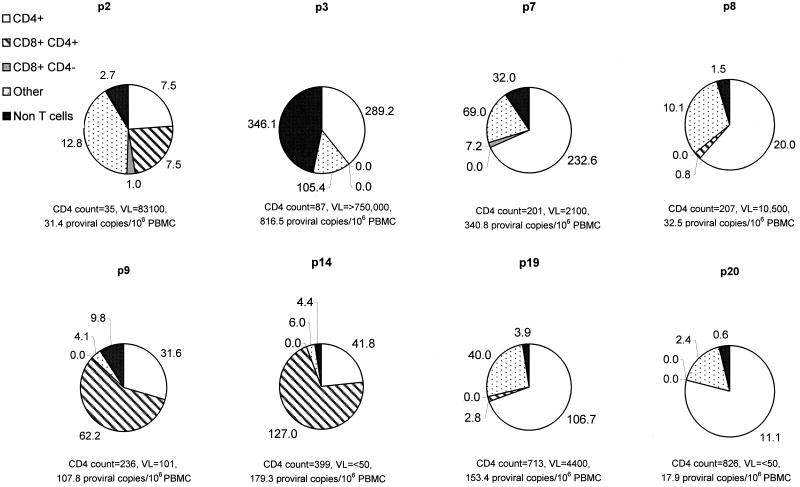
There is increasing evidence that CD8 lymphocytes may represent targets for infection by human immunodeficiency virus type 1 (HIV-1) in vivo whose destruction may contribute to the loss of immune function underlying AIDS. HIV-1 may infect thymic precursor cells destined to become CD4 and CD8 lymphocytes and contribute to the numerical decline in both subsets on disease progression. There is also evidence for the induction of CD4 expression and susceptibility to infection by HIV-1 of CD8 lymphocytes activated in vitro. To investigate the relationship between CD8 activation and infection by HIV-1 in vivo, activated subsets of CD8 lymphocytes in peripheral blood mononuclear cells (PBMCs) of HIV-seropositive individuals were investigated for CD4 expression and HIV infection. Activated CD8 lymphocytes were identified by expression of CD69, CD71, and the human leukocyte antigen (HLA) class II, the beta-chain of CD8, and the RO isoform of CD45. CD4(+) and CD4(-) CD8 lymphocytes, CD4 lymphocytes, other T cells, and non-T cells were purified using paramagnetic beads, and proviral sequences were quantified by PCR using primers from the long terminal repeat region. Frequencies of activated CD8 lymphocytes were higher in HIV-infected study subjects than in seronegative controls, and they frequently coexpressed CD4 (mean frequencies on CD69(+), CD71(+), and HLA class II(+) cells of 23, 37, and 8%, respectively, compared with 1 to 2% for nonactivated CD8 lymphocytes). The level of CD4 expression of the double-positive population approached that of mature CD4 lymphocytes. That CD4 expression renders CD8 cell susceptible to infection was indicated by their high frequency of infection in vivo; infected CD4(+) CD8 lymphocytes accounted for between 3 and 72% of the total proviral load in PBMCs from five of the eight study subjects investigated, despite these cells representing a small component of the PBMC population (<3%). Combined, these findings provide evidence that antigenic stimulation of CD8 lymphocytes in vivo induces CD4 expression that renders them susceptible to HIV infection and destruction. The specific targeting of responding CD8 lymphocytes may provide a functional explanation for the previously observed impairment of cytotoxic T-lymphocyte (CTL) function disproportionate to their numerical decline in AIDS and for the deletion of specific clones of CTLs responding to HIV antigens.
Figures
Similar articles
-
High levels of human immunodeficiency virus infection of CD8 lymphocytes expressing CD4 in vivo.J Virol. 2004 Sep;78(18):9862-71. doi: 10.1128/JVI.78.18.9862-9871.2004. J Virol. 2004. PMID: 15331721 Free PMC article.
-
Productive human immunodeficiency virus type 1 infection in peripheral blood predominantly takes place in CD4/CD8 double-negative T lymphocytes.J Virol. 2007 Sep;81(18):9693-706. doi: 10.1128/JVI.00492-07. Epub 2007 Jul 3. J Virol. 2007. PMID: 17609262 Free PMC article. Clinical Trial.
-
Infection of the CD45RA+ (naive) subset of peripheral CD8+ lymphocytes by human immunodeficiency virus type 1 in vivo.J Virol. 2001 May;75(9):4091-102. doi: 10.1128/JVI.75.9.4091-4102.2001. J Virol. 2001. PMID: 11287558 Free PMC article.
-
CD8 lymphocytes in HIV infection: helpful and harmful.J Clin Lab Immunol. 1997;49(1):15-32. J Clin Lab Immunol. 1997. PMID: 9819670 Review.
-
Immunological abnormalities in the natural history of HIV infection: mechanisms and clinical relevance.Immunodefic Rev. 1992;3(3):173-93. Immunodefic Rev. 1992. PMID: 1354968 Review.
Cited by
-
Could CD4 capture by CD8+ T cells play a role in HIV spreading?J Biomed Biotechnol. 2010;2010:907371. doi: 10.1155/2010/907371. Epub 2010 Mar 25. J Biomed Biotechnol. 2010. PMID: 20368790 Free PMC article.
-
High levels of human immunodeficiency virus infection of CD8 lymphocytes expressing CD4 in vivo.J Virol. 2004 Sep;78(18):9862-71. doi: 10.1128/JVI.78.18.9862-9871.2004. J Virol. 2004. PMID: 15331721 Free PMC article.
-
Gamma interferon/interleukin 10 balance in tissue lymphocytes correlates with down modulation of mucosal feline immunodeficiency virus infection.J Virol. 2004 Apr;78(8):4011-9. doi: 10.1128/jvi.78.8.4011-4019.2004. J Virol. 2004. PMID: 15047817 Free PMC article.
-
Legend or Truth: Mature CD4+CD8+ Double-Positive T Cells in the Periphery in Health and Disease.Biomedicines. 2023 Oct 5;11(10):2702. doi: 10.3390/biomedicines11102702. Biomedicines. 2023. PMID: 37893076 Free PMC article. Review.
-
Brain CD8+ and cytotoxic T lymphocytes are associated with, and may be specific for, human immunodeficiency virus type 1 encephalitis in patients with acquired immunodeficiency syndrome.J Neurovirol. 2006 Aug;12(4):272-83. doi: 10.1080/13550280600879204. J Neurovirol. 2006. PMID: 16966218
References
-
- Alkhatib G, Combadiere C, Broder C C, Feng Y, Kennedy P E, Murphy P M, Berger E A. CC CKR5: a RANTES, MIP-1 alpha, MIP-1 beta receptor as a fusion cofactor for macrophage-tropic HIV-1. Science. 1996;272:1955–1958. - PubMed
-
- Bass H Z, Hardy W D, Mitsuyasu R T, Wang Y X, Cumberland W, Fahey J L. Eleven lymphoid phenotypic markers in HIV infection: selective changes induced by zidovudine treatment. J Acquir Immune Defic Syndr. 1992;5:890–897. - PubMed
-
- Bass H Z, Nishanian P, Hardy W D, Mitsuyasu R T, Esmail E, Cumberland W, Fahey J L. Immune changes in HIV-1 infection: significant correlations and differences in serum markers and lymphoid phenotypic antigens. Clin Immunol Immunopathol. 1992;64:63–70. - PubMed
-
- Benito J M, Zabay J M, Gil J, Bermejo M, Escudero A, Sanchez E, Fernandez-Cruz E. Quantitative alterations of the functionally distinct subsets of CD4 and CD8 T lymphocytes in asymptomatic HIV infection: changes in the expression of CD45RO, CD45RA, CD11b, CD38, HLA-DR, and CD25 antigens. J Acquir Immune Defic Syndr Hum Retrovirol. 1997;14:128–135. - PubMed
Publication types
MeSH terms
Substances
LinkOut - more resources
Full Text Sources
Other Literature Sources
Research Materials
Miscellaneous
