

Identification and classification of differentially expressed genes in renal cell carcinoma by expression profiling on a global human 31,500-element cDNA array
- PMID: 11691851
- PMCID: PMC311168
- DOI: 10.1101/gr.184501
Identification and classification of differentially expressed genes in renal cell carcinoma by expression profiling on a global human 31,500-element cDNA array
Abstract
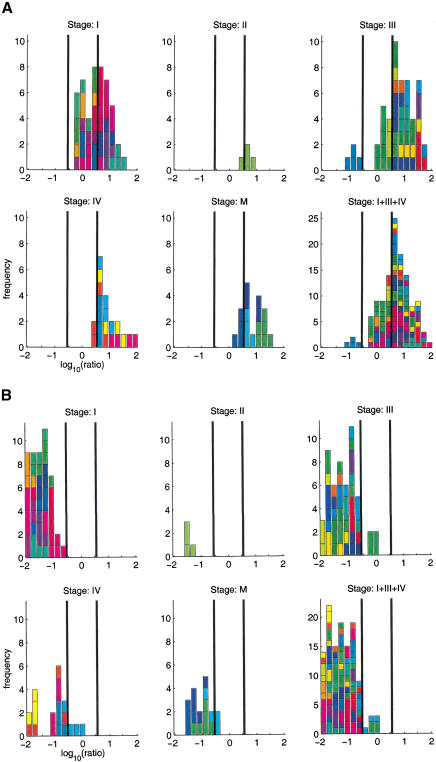
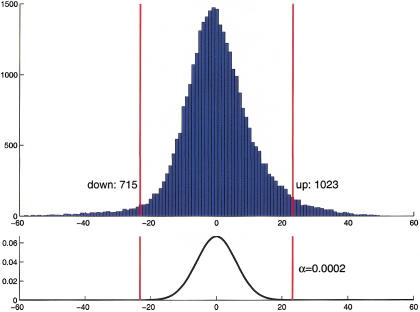
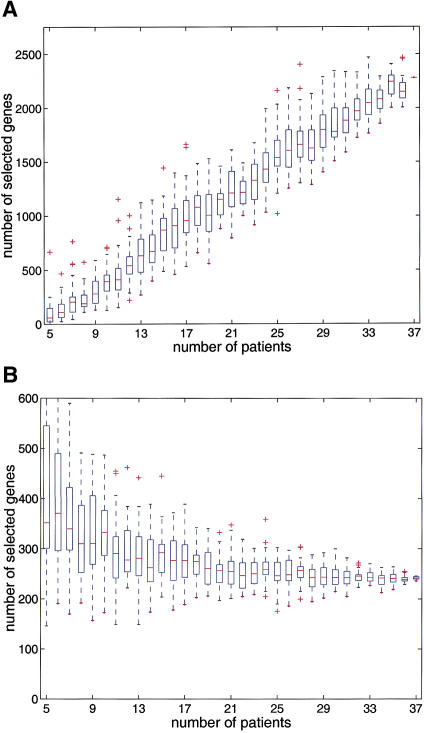
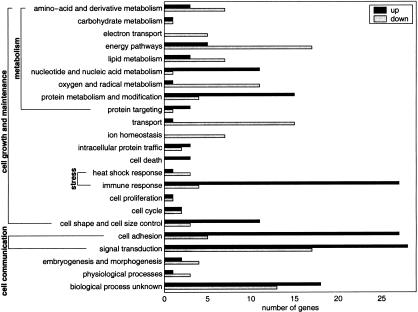
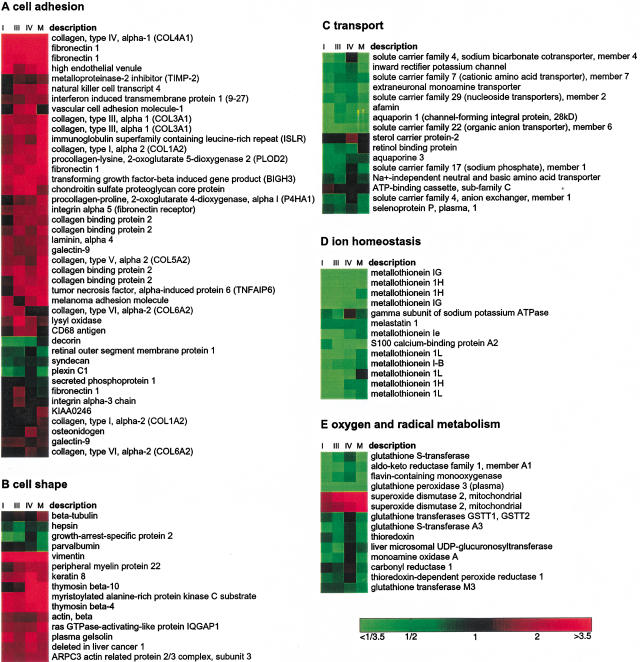
We investigated the changes in gene expression accompanying the development and progression of kidney cancer by use of 31,500-element complementary DNA arrays. We measured expression profiles for paired neoplastic and noncancerous renal epithelium samples from 37 individuals. Using an experimental design optimized for factoring out technological and biological noise, and an adapted statistical test, we found 1738 differentially expressed cDNAs with an expected number of six false positives. Functional annotation of these genes provided views of the changes in the activities of specific biological pathways in renal cancer. Cell adhesion, signal transduction, and nucleotide metabolism were among the biological processes with a large proportion of genes overexpressed in renal cell carcinoma. Down-regulated pathways in the kidney tumor cells included small molecule transport, ion homeostasis, and oxygen and radical metabolism. Our expression profiling data uncovered gene expression changes shared with other epithelial tumors, as well as a unique signature for renal cell carcinoma. [Expression data for the differentially expressed cDNAs are available as a Web supplement at http://www.dkfz-heidelberg.de/abt0840/whuber/rcc.]
Figures
Similar articles
-
Transcription profiling of renal cell carcinoma.Verh Dtsch Ges Pathol. 2002;86:153-64. Verh Dtsch Ges Pathol. 2002. PMID: 12647365 Review.
-
Microarray gene expression profiling and analysis in renal cell carcinoma.BMC Urol. 2004 Jun 22;4:9. doi: 10.1186/1471-2490-4-9. BMC Urol. 2004. PMID: 15212686 Free PMC article.
-
Expression profiling of human renal carcinomas with functional taxonomic analysis.BMC Bioinformatics. 2002 Sep 30;3:26. doi: 10.1186/1471-2105-3-26. BMC Bioinformatics. 2002. PMID: 12356337 Free PMC article.
-
Gene signatures of progression and metastasis in renal cell cancer.Clin Cancer Res. 2005 Aug 15;11(16):5730-9. doi: 10.1158/1078-0432.CCR-04-2225. Clin Cancer Res. 2005. PMID: 16115910
-
Significance of gene expression analysis of renal cell carcinoma.Expert Rev Anticancer Ther. 2006 Feb;6(2):293-9. doi: 10.1586/14737140.6.2.293. Expert Rev Anticancer Ther. 2006. PMID: 16445381 Review.
Cited by
-
A Network Biology Approach Identifies Molecular Cross-Talk between Normal Prostate Epithelial and Prostate Carcinoma Cells.PLoS Comput Biol. 2016 Apr 28;12(4):e1004884. doi: 10.1371/journal.pcbi.1004884. eCollection 2016 Apr. PLoS Comput Biol. 2016. PMID: 27124473 Free PMC article.
-
Molecular classification of renal tumors by gene expression profiling.J Mol Diagn. 2005 May;7(2):206-18. doi: 10.1016/S1525-1578(10)60547-8. J Mol Diagn. 2005. PMID: 15858144 Free PMC article.
-
Six1 expands the mouse mammary epithelial stem/progenitor cell pool and induces mammary tumors that undergo epithelial-mesenchymal transition.J Clin Invest. 2009 Sep;119(9):2663-77. doi: 10.1172/JCI37691. Epub 2009 Aug 24. J Clin Invest. 2009. PMID: 19726883 Free PMC article.
-
What can molecular pathology contribute to the management of renal cell carcinoma?Nat Rev Urol. 2011 May;8(5):255-65. doi: 10.1038/nrurol.2011.43. Epub 2011 Apr 12. Nat Rev Urol. 2011. PMID: 21487387 Review.
-
Genomic Analysis as the First Step toward Personalized Treatment in Renal Cell Carcinoma.Front Oncol. 2014 Jul 25;4:194. doi: 10.3389/fonc.2014.00194. eCollection 2014. Front Oncol. 2014. PMID: 25120953 Free PMC article. Review.
References
-
- Alizadeh AA, Eisen MB, Davis RE, Ma C, Lossos IS, Rosenwald A, Boldrick JC, Sabet H, Tran T, Yu X, et al. Distinct types of diffuse large B-cell lymphoma identified by gene expression profiling. Nature. 2000;403:503–511. - PubMed
-
- Beißbarth T, Fellenberg K, Brors B, Arribas-Prat R, Boer JM, Hauser NC, Scheideler M, Hoheisel JD, Schütz G, Poustka A, et al. Processing and quality control of DNA array hybridization data. Bioinformatics. 2000;16:1014–1022. - PubMed
-
- Bittner M, Meltzer P, Chen Y, Jiang Y, Seftor E, Hendrix M, Radmacher M, Simon R, Yakhini Z, Ben-Dor A, et al. Molecular classification of cutaneous malignant melanoma by gene expression profiling. Nature. 2000;406:536–540. - PubMed
Publication types
MeSH terms
LinkOut - more resources
Full Text Sources
Other Literature Sources
Medical
Molecular Biology Databases