. 2001 Nov 1;536(Pt 3):879-91.
doi: 10.1111/j.1469-7793.2001.00879.x.

Temperature dependence of active tension in mammalian (rabbit psoas) muscle fibres: effect of inorganic phosphate

Affiliations

Temperature dependence of active tension in mammalian (rabbit psoas) muscle fibres: effect of inorganic phosphate

M E Coupland et al. J Physiol. .

Abstract

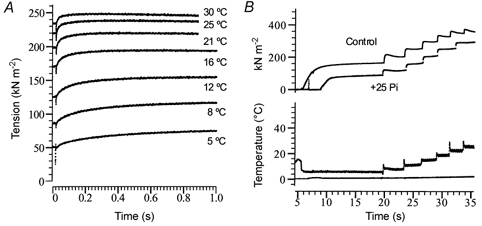
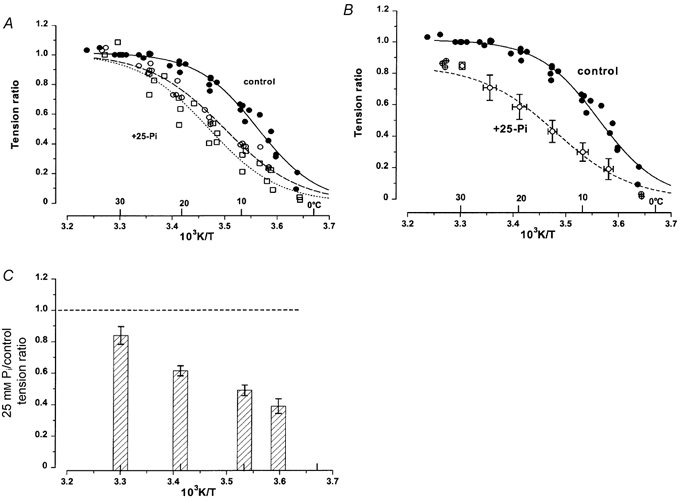
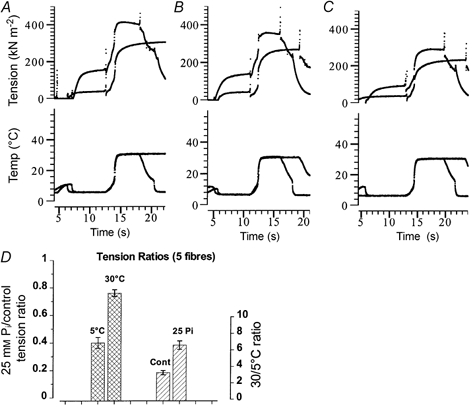
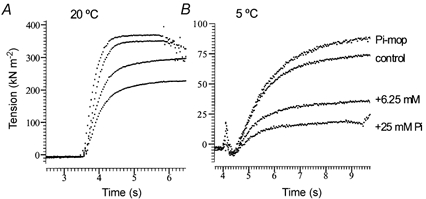
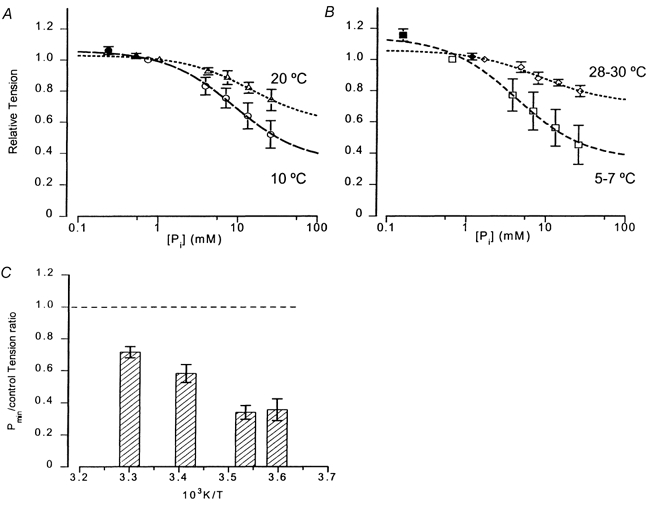
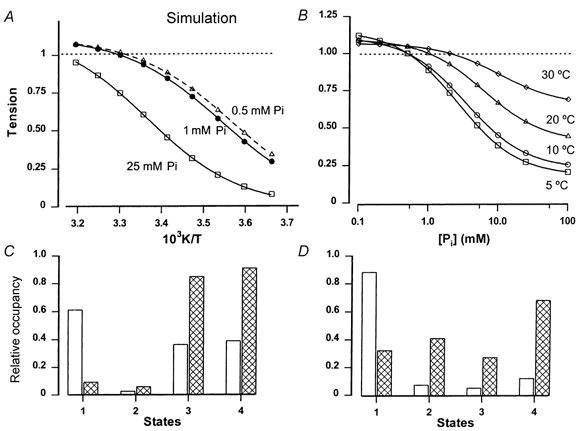
1. The effect of added inorganic phosphate (P(i), range 3-25 mM) on active tension was examined at a range of temperatures (5-30 degrees C) in chemically skinned (0.5 % Brij) rabbit psoas muscle fibres. Three types of experiments were carried out. 2. In one type of experiment, a muscle fibre was maximally activated at low temperature (5 degrees C) and its tension change was recorded during stepwise heating to high temperature in approximately 60 s. As found in previous studies, the tension increased with temperature and the normalised tension-(reciprocal) temperature relation was sigmoidal, with a half-maximal tension at 8 degrees C. In the presence of 25 mM added P(i), the temperature for half-maximal tension of the normalised curve was approximately 5 degrees C higher than in the control. The difference in the slope was small. 3. In a second type of experiment, the tension increment during a large temperature jump (from 5 to 30 degrees C) was examined during an active contraction. The relative increase of active tension on heating was significantly higher in the presence of 25 mM added P(i) (30/5 degrees C tension ratio of 6-7) than in the control with no added P(i) (tension ratio of approximately 3). 4. In a third type of experiment, the effect on the maximal Ca(2+)-activated tension of different levels of added P(i) (3-25 mM) (and P(i) mop adequate to reduce contaminating P(i) to micromolar levels) was examined at 5, 10, 20 and 30 degrees C. The tension was depressed with increased [P(i)] in a concentration-dependent manner at all temperatures, and the data could be fitted with a hyperbolic relation. The calculated maximal tension depression in excess [P(i)] was approximately 65 % of the control at 5-10 degrees C, in contrast to a maximal depression of 40 % at 20 degrees C and 30 % at 30 degrees C. 5. These experiments indicate that the active tension depression induced by P(i) in psoas fibres is temperature sensitive, the depression becoming less marked at high temperatures. A reduced P(i)-induced tension depression is qualitatively predicted by a simplified actomyosin ATPase cycle where a pre-phosphate release, force-generation step is enhanced by temperature.


Figures

Figure 1
Figure 1. Active tension recording at a number of temperatures
A, sample tension records from a fibre; the fibre was maximally Ca2+ activated at 2 °C (not shown) and temperature was increased by (3–4 °C) laser temperature jumps, while the Peltier T-clamp was set to rise to 30 °C. Superimposed tension transients in response to each T-jump (and the end-temperature) are shown. The fibre was relaxed after the final T-jump (at 30 °C, top trace) and the total duration of contraction was ≈60 s. Note that the relative amplitude of the tension rise to a standard T-jump decreased at higher temperatures. B, two superimposed tension records from a fibre, which was activated at 5 °C and heated to 30 °C, by 4–5 °C laser T-jumps and T-clamps (see Ranatunga, 1996); the fibre was relaxed soon afterwards (not shown). Only one temperature trace (bottom panel) is shown for clarity; it was made using a thermocouple placed close to the muscle fibre. The active force at 5 °C was depressed by 40–50 % in the presence of 25 mm Pi (lower trace), but the marked rise of tension with heating can be seen in both this trace and in the control (no added Pi, upper trace); the relative Pi-induced depression is less at higher temperatures.
Figure 2
Figure 2. Active tension versus temperature relation - effect of [Pi]
Pooled data from five fibres in each of which tension data were collected at different temperatures (range ≈5–30 °C) during one control and one or two test (25 mm Pi) contractions. A fibre was activated at ≈5 °C, and the temperature raised by laser T-jumps and/or Peltier heating (see Fig. 1). A, tensions recorded in each contraction were normalised to that at 30 °C, and plotted against reciprocal absolute temperature in the abscissa (also labelled in °C). Note that, within the range 2.5–32.5 °C, each fibre contributes only one data point per 5 °C temperature interval (i.e. for 2.4–7.4 °C, for 7.5–12.4 °C, etc.), but two to three data points outside this range are also plotted. Filled circles and continuous curve are from activation in control solutions (no added Pi); open circles and dashed curve are from activation in 25 mm Pi solutions prior to control activation; open squares and dotted curve are from activation in 25 mm Pi after a control activation. The fitted sigmoidal curves (see Methods) correspond to temperatures for 50 % tension of 8 °C for control and 13–15 °C for Pi curves; the slope corresponds to ΔH (in kJ mol−1 K−1) of 143 in control, 116–124 with Pi. Thus, Pi seems to shift the tension-temperature relation to higher temperatures. B, control data (•) are as shown in A. The tensions in the presence of 25 mm Pi from two series (i.e. before and after control) were adjusted to the depression obtained at 30 °C: they were pooled and the open symbols are the means and the error bars, standard deviations. Note that the relative Pi-induced depression of tension was less at the higher temperatures. The tension data with and without Pi and at different temperatures were significantly different (P < 0.05). C, tension recorded in 25 mm Pi was presented as a ratio of that in control solution and mean (±s.e.m.) tension ratios from the five fibres are shown for 30, 20, 10 and 5 °C. Differences in the ratios at 30 °C and 5–10 °C were significant (P < 0.001).
Figure 3
Figure 3. Large T-jump experiments and tension decline
AC, the fibre was activated at low temperature (4–6 °C) in a rear trough and T-jumped by transferring to the front trough containing the same activation solution clamped at 30 °C; the fibre was then relaxed (not shown completely in all cases). The procedure was repeated at intervals of 15–20 min, activation in alternate contractions being in the presence of 25 mm Pi. A thermocouple placed within 0.2 mm of the fibre, that moved with the fibre, provided the temperature records (lower frames); the temperature record provides an approximate indication of the temperature that a fibre gets exposed to during this procedure. Each frame contains a pair of records, one in control solution (larger tension trace) and the other in 25 mm Pi-containing activating solution. The sequence of recording was: A, contractions 1 and 2, B, contractions 3 and 4 and C, contractions 7 and 8. Note that compared to the control tension, the tension with Pi was reduced more at low temperature than at 30 °C. (For convenient comparison, traces in a frame were horizontally displaced so as to synchronise the T-jump in a pair. The first two contractions were recorded without creatine kinase (CK); 2–3 mg ml−1 CK was present for the other recordings.) D, pooled data from five fibres. Only the first four contractions were taken for the analyses. Cross-hatched bars and left ordinate show the 25 mm Pi/control tension ratios from each contraction (mean ±s.e.m., n = 8) at 4–6 °C and 30 °C. The tension in the presence of 25 mm Pi is ≈80 % of control at 30 °C, whereas it was ≈40 % at ≈5 °C. Hatched bars and right ordinate show the 30/≈5 °C tension ratios for control and 25 mm Pi contractions: thus the tension increased by threefold in the control, but it increased by six to sevenfold in the presence of 25 mm Pi when the temperature was raised from 5 °C to 30 °C. Results are basically similar to those obtained in the previous experiment (see Fig. 2C and text).
Figure 4
Figure 4. Effect of [Pi] on active tension
Sample tension records from a fibre at two different steady temperatures, 20 °C (A) and 5 °C (B). Separate contractions were recorded in activating solutions containing different levels of Pi, after the fibre was pre-equilibrated at the same Pi level in relaxing and pre-activating solutions. Only the activation to a steady tension level is shown for clarity, i.e. the fibre relaxation is not shown. In both A and B, the largest tension record was made in solution containing Pi mop (0.8 U ml−1 of sucrose phosphorylase + 10 mm sucrose; see Methods). The other three records - in sequence of decreasing amplitude - were in the control solution (no added Pi or mop), or solutions with 6.25 mm and 25 mm added Pi. Note that tension rise is slower and the tensions are markedly lower at the low temperature (5 °C, B), but the relative magnitude of the Pi-induced depression is much more pronounced. The control tension at the series end was 99 % at 20 °C and 90 % at 5 °C. (Tension traces were horizontally displaced in order to superimpose the onset of activation.)
Figure 5
Figure 5. Active tension versus[Pi] relation at different temperatures
A, pooled tension data (with their standard deviations) collected for different Pi concentrations at 10 °C (circles, 24 fibres) and at 20 °C (triangles, 13 fibres). Data were collected from each fibre in control solution (no added Pi) and in solutions with 3.1, 6.25, 12.5 and 25 mm added Pi and normalised to the initial control tension (the control tension after a series was (mean ±s.d.) 0.97 ± 0.06 at 10 °C and 0.95 ± 0.05 at 20 °C). The mean (±s.d.) normalised tension is plotted on the ordinate against [Pi] within the fibre on a logarithmic abscissa. For 10 °C, [Pi] was taken as 0.735 mm in the control and as 0.735 mm+ added [Pi] for others; the corresponding values for 20 °C were 1.17 mm (control) and 1.17 mm+ added [Pi] (see Methods). The filled symbols are the normalised tensions obtained with a Pi mop (from nine fibres at 10 °C, three of which also contributed data to the full series, and from four fibres at 20 °C, two of which contributed to the full series; they are plotted at fibre generated [Pi] - see Methods). The curve through each set of points is the hyperbolic relation fitted to the pooled data. The Pmax, Pmin and Kd values (mean ±s.e.m.) from the curve fits are 1.06 ± 0.02, 0.34 ± 0.04 and 8.8 ± 1.5 mm for 10 °C and 1.03 ± 0.01, 0.58 ± 0.06 and 14.6 ± 4.4 mm for 20 °C. Data obtained at more than one temperature in a few individual fibres (n = 6) also indicated the same trends. The difference in the tension reduction with 3–25 mm added [Pi] was significant between the two temperatures (P < 0.01). B, data similar to A, but for 5–7 °C (squares) and for 28–30 °C (diamonds). Curve fits are for pooled data from a total of eight fibres at ≈5 °C (Pi mop from four fibres - filled symbol, two of which also contributed to the full series) and from a total of six fibres at ≈30 °C (Pi mop from three fibres, all contributing to the full series). The Pmax, Pmin and Kd values (mean ±s.e.m.) from the curve fits are 1.14 ± 0.04, 0.36 ± 0.07 and 4.2 ± 1.4 mm for ≈5 °C and 1.06 ± 0.02, 0.71 ± 0.04 and 8.3 ± 3.0 mm for ≈30 °C (P < 0.001). C, predicted tension level (mean ±s.e.m. from curve fit) at excess [Pi], i.e. Pmin, at ≈5, 10, 20 and ≈30 °C; dashed line represents the tension level in the control. Note that the maximum Pi-induced depression is similar between ≈5 and 10 °C, but is markedly decreased at higher temperatures. Differences are significant (P < 0.05) except between 5 and 10 °C and between 20 and 30 °C.
Figure 6
Figure 6. Behaviour of simulated tension from a three-state model
A, plots of calculated tension (symbols) versus reciprocal absolute temperature (full range - 0 to 40 °C, at 5 °C intervals) for a number of different [Pi] levels. Temperature increase was simulated by increasing ka (Q10 3) in the scheme and [Pi] was constant at 0.5 mm (▵), 1 mm (•) and 25 mm (□) by pre-setting kd. Tension normalised to that at 30 °C with 1 mm[Pi] is plotted and sigmoidal curves (see Methods) are fitted through each set of points. The curves give temperatures for 50 % tension of 7.5 °C (0.5 mm Pi), 9.5 °C (1 mm Pi) and 23 °C (25 mm Pi); the slopes correspond to ΔH of 70–74 kJ mol−1 K−1 in the three curves. B, Pi dependence of simulated tension at 5 °C (□), 10 °C (○), 20 °C (▵) and 30 °C (⋄). Tensions are normalised to calculated [Pi] level within the fibre in control solutions; lines are fitted hyperbolic relations to the symbols. Both Kd and Pmin increase with temperature, from 2.6 mm and 0.18 at 5 °C to 10 mm and 0.65 at 30 °C. C, the relative steady-state occupancy of the three crossbridge/actomyosin states at 5 °C (open bars) and 30 °C (cross-hatched bars) with [Pi] pre-set at 1 mm. State 1 is AM.ADP.Pi; state 2, AM*.ADP.Pi; and state 3, AM*.ADP (see Methods). Bars labelled state 4 represent states 2 + 3 (high force states), which is taken as tension; note that 30/5 °C tension ratio is ≈2.3. D, data similar to C, but with [Pi] pre-set at 25 mm. Note that 30/5 °C tension ratio is ≈6.

Similar articles

Cited by

References

    1. Bershitsky SY, Tsaturyan AK. Tension responses to joule temperature jump in skinned rabbit muscle fibres. Journal of Physiology. 1992;447:425–448. - PMC - PubMed
    1. Brown DES. Temperature-pressure relation in muscular contraction. In: Johnson FH, editor. Influence of Temperature on Biological Systems. Washington: American Physiological Society; 1957. pp. 83–100.
    1. Cooke R, Pate E. The effects of ADP and phosphate on the contraction of muscle fibers. Biophysical Journal. 1985;48:789–798. - PMC - PubMed
    1. Coupland ME, Puchert E, Ranatunga KW. Interactive effects of inorganic phosphate and temperature on calcium sensitivity of active force in skinned rabbit muscle fibres. Journal of Muscle Research and Cell Motility. 1999;20:820. (abstract)
    1. Dantzig JA, Goldman YE, Millar NC, Lacktis J, Homsher E. Reversal of the cross-bridge force-generating transition by photogeneration of phosphate in rabbit psoas muscle fibres. Journal of Physiology. 1992;451:247–278. - PMC - PubMed

Publication types

LinkOut - more resources