. 2001 Nov 1;29(21):4414-22.
doi: 10.1093/nar/29.21.4414.

Quantitative amplification of single-stranded DNA (QAOS) demonstrates that cdc13-1 mutants generate ssDNA in a telomere to centromere direction

Affiliations

Quantitative amplification of single-stranded DNA (QAOS) demonstrates that cdc13-1 mutants generate ssDNA in a telomere to centromere direction

C Booth et al. Nucleic Acids Res. .

Abstract

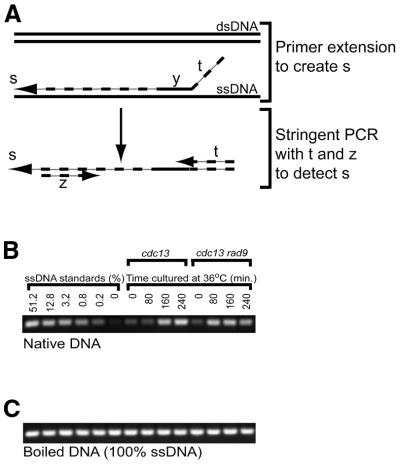
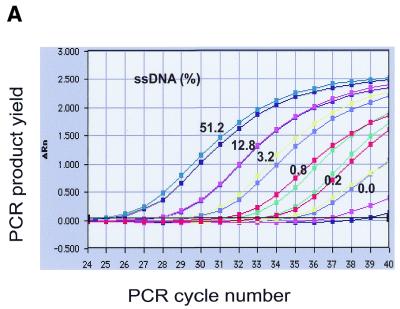
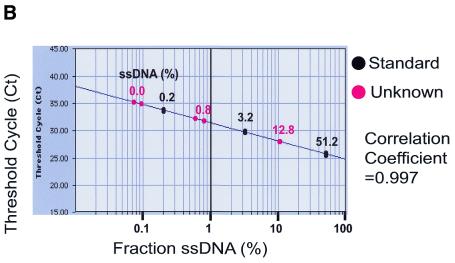
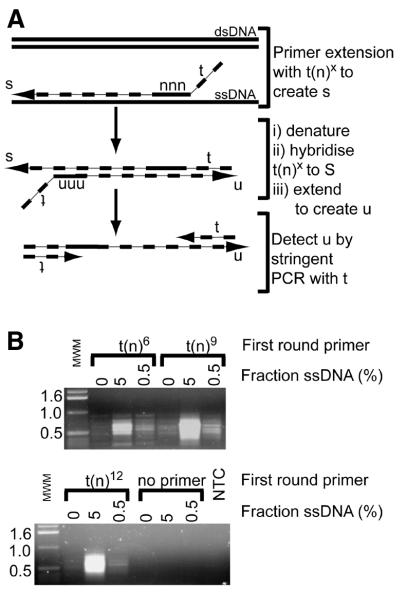
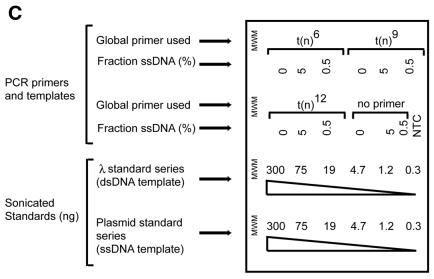
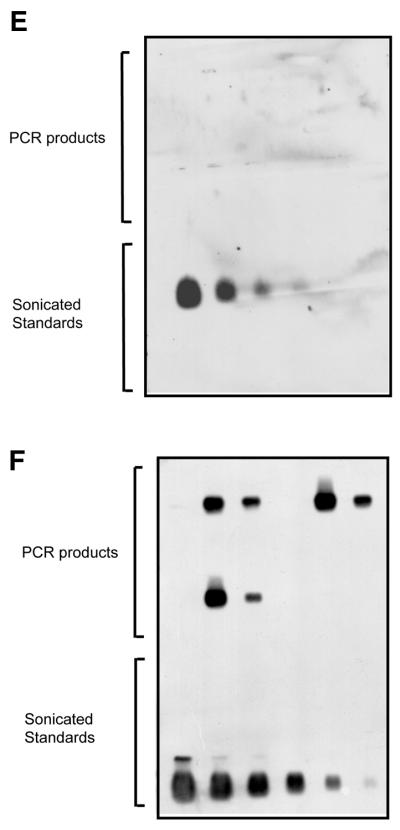
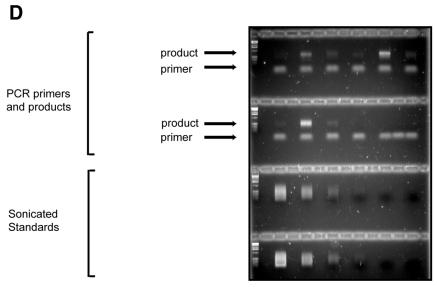
We have developed a method that allows quantitative amplification of single-stranded DNA (QAOS) in a sample that is primarily double-stranded DNA (dsDNA). Single-stranded DNA (ssDNA) is first captured by annealing a tagging primer at low temperature. Primer extension follows to create a novel, ssDNA-dependent, tagged molecule that can be detected by PCR. Using QAOS levels of between 0.2 and 100% ssDNA can be accurately quantified. We have used QAOS to characterise ssDNA levels at three loci near the right telomere of chromosome V in budding yeast cdc13-1 mutants. Our results confirm and extend previous studies which demonstrate that when Cdc13p, a telomere-binding protein, is disabled, loci close to the telomere become single stranded whereas centromere proximal sequences do not. In contrast to an earlier model, our new results are consistent with a model in which a RAD24-dependent, 5' to 3' exonuclease moves from the telomere toward the centromere in cdc13-1 mutants. QAOS has been adapted, using degenerate tagging primers, to preferentially amplify all ssDNA sequences within samples that are primarily dsDNA. This approach may be useful for identifying ssDNA sequences associated with physiological or pathological states in other organisms.


Figures

Figure 1
Figure 1
(A) Schematic outline of QAOS. A tagging primer, ty, containing a tag t at its 5′ end, binds to ssDNA, at low temperature, via the y region at its 3′ end. A round of primer extension creates a novel molecule s, that contains the t sequence at its 5′ end. s is detected by stringent PCR using primers t and z (a reverse primer) at temperatures which allow binding of primers t and z, but which are too high to allow binding of the y sequences to ssDNA generated during each cycle of PCR. (B) Application of QAOS to native samples. An ethidium bromide stained agarose gel shows the amount of YER186C PCR product obtained following the application of QAOS to samples containing various amounts of ssDNA. The left half of the gel shows the amount of PCR product obtained from a 4-fold dilution series of ssDNA. The right half of the gel shows the amount of PCR product obtained when QAOS was applied to DNA purified from yeast cells that accumulate ssDNA in vivo. The yeast contained cdc13 (DLY408) or cdc13 rad9 (DLY409) mutations and had been cultured at the non-permissive temperature of 36°C, for 0, 80, 160 and 240 min, before their DNA was extracted. (C) Application of QAOS to boiled (100% ssDNA) samples. Samples are identical to those in (B) except they were boiled before QAOS was performed.
Figure 2
Figure 2
Real-time QAOS. (A) Amplification plots of real-time QAOS samples. A duplicate 4-fold dilution series, as described in Figure 1B, was subject to real-time QAOS. The products of PCR are measured as an increase in fluorescence (ΔRn) and are plotted versus PCR cycle number. Duplicate samples are labelled together, the two lines without labels at the right side of the graph contained no target DNA and the small amount of signal is probably due to contamination. (B) Construction of a standard curve to measure the fraction of ssDNA. The samples in (A) have been classified as standards (51.2, 3.2 or 0.2% ssDNA, black) or unknowns (12.8, 0.8 and 0% ssDNA, red). The threshold cycle, the point at which the fluorescence (ΔRn) reached a fixed value for each sample, is plotted versus the fraction of ssDNA that was present initially. A regression line has been drawn through the standards (correlation coefficient 0.997) and can be used to calculate the fraction of ssDNA in the unknown samples (drawn as red dots on the regression line).
Figure 2
Figure 2
Real-time QAOS. (A) Amplification plots of real-time QAOS samples. A duplicate 4-fold dilution series, as described in Figure 1B, was subject to real-time QAOS. The products of PCR are measured as an increase in fluorescence (ΔRn) and are plotted versus PCR cycle number. Duplicate samples are labelled together, the two lines without labels at the right side of the graph contained no target DNA and the small amount of signal is probably due to contamination. (B) Construction of a standard curve to measure the fraction of ssDNA. The samples in (A) have been classified as standards (51.2, 3.2 or 0.2% ssDNA, black) or unknowns (12.8, 0.8 and 0% ssDNA, red). The threshold cycle, the point at which the fluorescence (ΔRn) reached a fixed value for each sample, is plotted versus the fraction of ssDNA that was present initially. A regression line has been drawn through the standards (correlation coefficient 0.997) and can be used to calculate the fraction of ssDNA in the unknown samples (drawn as red dots on the regression line).
Figure 3
Figure 3
Detection of ssDNA at telomeric loci in cdc13-1 mutants. (A) The location of four loci along the right arm of chromosome V. The 3′ strand of the telomere consists of TG repeats and the 5′ strand of AC repeats. (B) Appearance of ssDNA on the TG strand in cdc13-1mutants. QAOS was used to measure ssDNA levels in synchronous cultures of cdc13-1 mutants. QAOS primers detected ssDNA on the strand that ends with the 3′, TG, sequences at the telomere. The yeast strains analysed were DLY408 cdc13-1 RAD+ (squares), DLY409 cdc13-1 rad9Δ (diamonds), DLY410 cdc13-1 rad24Δ (circles) and DLY411 cdc13-1 rad9Δ rad24Δ (triangles). (C) Appearance of ssDNA on the AC strand in cdc13-1 mutants. QAOS primers were chosen to detect ssDNA on the DNA strand that ends with the 5′, AC, sequences at the telomere. The samples and symbols are the same as in (B).
Figure 4
Figure 4
Global QAOS. (A) Outline of global QAOS. A random tagging primer t(n) x, containing a tag t, and a random nucleic acid-binding sequence with x random nucleotides, anneals to ssDNA. The first round of primer extension creates a library of molecule s. The mixture is then denatured, and cooled to allow the primer t(n)x to anneal to the library of molecule s. A second round of primer extension creates a library of molecules u. The library u is amplified by stringent PCR using the primer t. (B) Detection of ssDNA-dependent PCR products. Samples containing 0, 5 and 0.5% ssDNA were mixed with random tagging primers containing 6 = t(n)6, 9 = t(n)9 or 12 = t(n)12 random nucleotides at the 3′ end. A no template control (NTC) and no first round primer controls were also subject to global QAOS. After PCR the samples were analysed by agarose gel electrophoresis, along with molecular weight markers (MWM). The sizes of the major molecular weight markers are indicated on the left in kilobases. (C) Key of agarose gel examined in (D–F). The same set of samples described in (B), and a 4-fold dilution series of sonicated DNA standards were separated on an agarose gel. The λ standard series contained sonicated λ DNA (the dsDNA initially present in all tubes). The plasmid standard series contained sonicated, double-stranded, plasmid DNA (that had been present, in single stranded form, in the 5 and 0.5% ssDNA samples). (D) Agarose gel stained with ethidium bromide after electrophoresis. The samples are as described in (C). The low molecular weight bands present in the top two rows are PCR primers. The bands visible above the primers are the ssDNA-dependent PCR product. (E) Southern blot hybridised to λ DNA (dsDNA) probe. The gel was blotted on to a nylon membrane and hybridised with labelled λ DNA. (F)Southern blot hybridised to plasmid DNA (ssDNA) probe. The gel in (D) was blotted on to a nylon membrane and hybrised with labelled plasmid DNA.
Figure 4
Figure 4
Global QAOS. (A) Outline of global QAOS. A random tagging primer t(n) x, containing a tag t, and a random nucleic acid-binding sequence with x random nucleotides, anneals to ssDNA. The first round of primer extension creates a library of molecule s. The mixture is then denatured, and cooled to allow the primer t(n)x to anneal to the library of molecule s. A second round of primer extension creates a library of molecules u. The library u is amplified by stringent PCR using the primer t. (B) Detection of ssDNA-dependent PCR products. Samples containing 0, 5 and 0.5% ssDNA were mixed with random tagging primers containing 6 = t(n)6, 9 = t(n)9 or 12 = t(n)12 random nucleotides at the 3′ end. A no template control (NTC) and no first round primer controls were also subject to global QAOS. After PCR the samples were analysed by agarose gel electrophoresis, along with molecular weight markers (MWM). The sizes of the major molecular weight markers are indicated on the left in kilobases. (C) Key of agarose gel examined in (D–F). The same set of samples described in (B), and a 4-fold dilution series of sonicated DNA standards were separated on an agarose gel. The λ standard series contained sonicated λ DNA (the dsDNA initially present in all tubes). The plasmid standard series contained sonicated, double-stranded, plasmid DNA (that had been present, in single stranded form, in the 5 and 0.5% ssDNA samples). (D) Agarose gel stained with ethidium bromide after electrophoresis. The samples are as described in (C). The low molecular weight bands present in the top two rows are PCR primers. The bands visible above the primers are the ssDNA-dependent PCR product. (E) Southern blot hybridised to λ DNA (dsDNA) probe. The gel was blotted on to a nylon membrane and hybridised with labelled λ DNA. (F)Southern blot hybridised to plasmid DNA (ssDNA) probe. The gel in (D) was blotted on to a nylon membrane and hybrised with labelled plasmid DNA.

References

    1. Sassanfar M. and Roberts,J.W. (1990) Nature of the SOS-inducing signal in Escherichia coli. The involvement of DNA replication. J. Mol. Biol., 212, 79–96. - PubMed
    1. Bishop D.K., Park,D., Xu,L. and Kleckner,N. (1992) DMC1: a meiosis-specific yeast homolog of E.coli recA required for recombination, synaptonemal complex formation and cell cycle progression. Cell, 69, 439–456. - PubMed
    1. Lydall D., Nikolsky,Y., Bishop,D.K. and Weinert,T. (1996) A meiotic recombination checkpoint controlled by mitotic checkpoint genes. Nature, 383, 840–843. - PubMed
    1. Huang L.C., Clarkin,K.C. and Wahl,G.M. (1996) Sensitivity and selectivity of the DNA damage sensor responsible for activating p53-dependent G1 arrest. Proc. Natl Acad. Sci. USA, 93, 4827–4832. - PMC - PubMed
    1. Okazaki R., Okazaki,T., Sakabe,K., Sugimoto,K. and Sugino,A. (1968) Mechanism of DNA chain growth. I. Possible discontinuity and unusual secondary structure of newly synthesized chains. Proc. Natl Acad. Sci. USA, 59, 598–605. - PMC - PubMed

Publication types

MeSH terms