

The forkhead transcription factor Foxo1 (Fkhr) confers insulin sensitivity onto glucose-6-phosphatase expression
- PMID: 11696581
- PMCID: PMC209440
- DOI: 10.1172/JCI12876
The forkhead transcription factor Foxo1 (Fkhr) confers insulin sensitivity onto glucose-6-phosphatase expression
Abstract
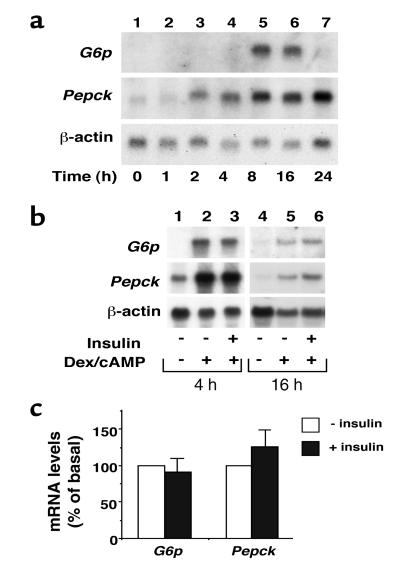
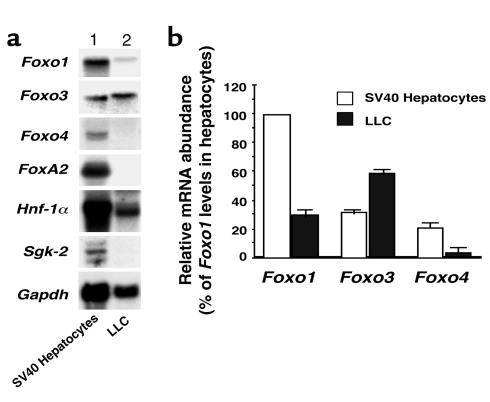
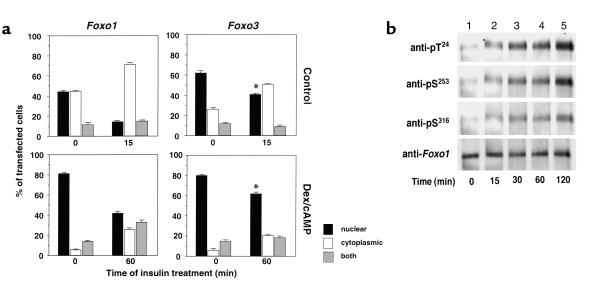
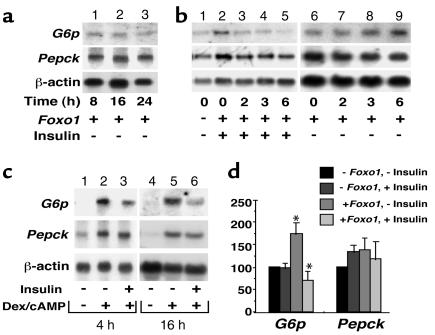
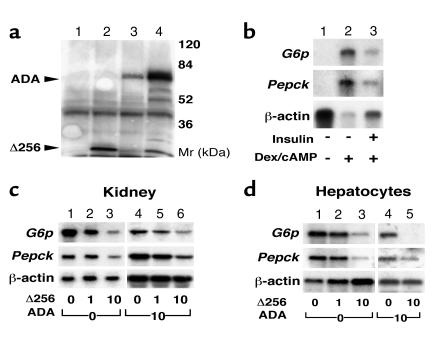
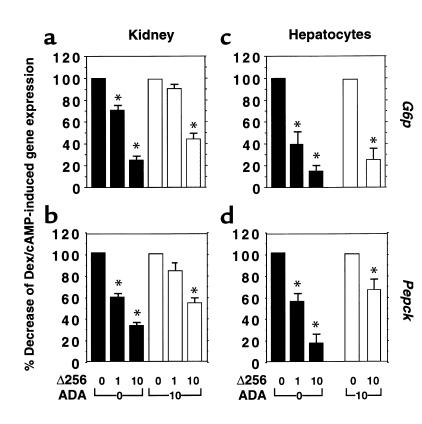
Type 2 diabetes is characterized by the inability of insulin to suppress glucose production in the liver and kidney. Insulin inhibits glucose production by indirect and direct mechanisms. The latter result in transcriptional suppression of key gluconeogenetic and glycogenolytic enzymes, phosphoenolpyruvate carboxykinase (Pepck) and glucose-6-phosphatase (G6p). The transcription factors required for this effect are incompletely characterized. We report that in glucogenetic kidney epithelial cells, Pepck and G6p expression are induced by dexamethasone (dex) and cAMP, but fail to be inhibited by insulin. The inability to respond to insulin is associated with reduced expression of the forkhead transcription factor Foxo1, a substrate of the Akt kinase that is inhibited by insulin through phosphorylation. Transduction of kidney cells with recombinant adenovirus encoding Foxo1 results in insulin inhibition of dex/cAMP-induced G6p expression. Moreover, expression of dominant negative Foxo1 mutant results in partial inhibition of dex/cAMP-induced G6p and Pepck expression in primary cultures of mouse hepatocyes and kidney LLC-PK1-FBPase(+) cells. These findings are consistent with the possibility that Foxo1 is involved in insulin regulation of glucose production by mediating the ability of insulin to decrease the glucocorticoid/cAMP response of G6p.
Figures
Similar articles
-
Regulation of glucose-6-phosphatase gene expression by protein kinase Balpha and the forkhead transcription factor FKHR. Evidence for insulin response unit-dependent and -independent effects of insulin on promoter activity.J Biol Chem. 2000 Nov 17;275(46):36324-33. doi: 10.1074/jbc.M003616200. J Biol Chem. 2000. PMID: 10960473
-
Insulin regulation of gene expression through the forkhead transcription factor Foxo1 (Fkhr) requires kinases distinct from Akt.Biochemistry. 2001 Oct 2;40(39):11768-76. doi: 10.1021/bi015532m. Biochemistry. 2001. PMID: 11570877
-
Differential regulation of endogenous glucose-6-phosphatase and phosphoenolpyruvate carboxykinase gene expression by the forkhead transcription factor FKHR in H4IIE-hepatoma cells.Biochem Biophys Res Commun. 2001 Jul 27;285(4):897-902. doi: 10.1006/bbrc.2001.5261. Biochem Biophys Res Commun. 2001. PMID: 11467835
-
Regulation of hepatic insulin-like growth factor-binding protein-1 gene expression by insulin: central role for mammalian target of rapamycin independent of forkhead box O proteins.Endocrinology. 2006 May;147(5):2383-91. doi: 10.1210/en.2005-0902. Epub 2006 Feb 2. Endocrinology. 2006. PMID: 16455781
-
Insulin regulation of PEPCK gene expression: a model for rapid and reversible modulation.Curr Drug Targets Immune Endocr Metabol Disord. 2005 Dec;5(4):423-37. doi: 10.2174/156800805774912962. Curr Drug Targets Immune Endocr Metabol Disord. 2005. PMID: 16375695 Review.
Cited by
-
Neuroendocrine and metabolic components of dopamine agonist amelioration of metabolic syndrome in SHR rats.Diabetol Metab Syndr. 2014 Sep 25;6:104. doi: 10.1186/1758-5996-6-104. eCollection 2014. Diabetol Metab Syndr. 2014. PMID: 25937836 Free PMC article.
-
Pyrvinium Treatment Confers Hepatic Metabolic Benefits via β-Catenin Downregulation and AMPK Activation.Pharmaceutics. 2021 Mar 4;13(3):330. doi: 10.3390/pharmaceutics13030330. Pharmaceutics. 2021. Retraction in: Pharmaceutics. 2023 May 30;15(6):1623. doi: 10.3390/pharmaceutics15061623. PMID: 33806415 Free PMC article. Retracted.
-
PTEN-mediated Akt/β-catenin/Foxo1 signaling regulates innate immune responses in mouse liver ischemia/reperfusion injury.Hepatology. 2013 Jan;57(1):289-98. doi: 10.1002/hep.25958. Epub 2012 Dec 4. Hepatology. 2013. PMID: 22807038 Free PMC article.
-
Regulation of hepatic fasting response by PPARgamma coactivator-1alpha (PGC-1): requirement for hepatocyte nuclear factor 4alpha in gluconeogenesis.Proc Natl Acad Sci U S A. 2003 Apr 1;100(7):4012-7. doi: 10.1073/pnas.0730870100. Epub 2003 Mar 21. Proc Natl Acad Sci U S A. 2003. PMID: 12651943 Free PMC article.
-
Hepatic FoxOs link insulin signaling with plasma lipoprotein metabolism through an apolipoprotein M/sphingosine-1-phosphate pathway.J Clin Invest. 2022 Apr 1;132(7):e146219. doi: 10.1172/JCI146219. J Clin Invest. 2022. PMID: 35104242 Free PMC article.
References
-
- Saltiel AR. New perspectives into the molecular pathogenesis and treatment of type 2 diabetes. Cell. 2001;104:517–529. - PubMed
-
- Cherrington AD. Banting Lecture 1997. Control of glucose uptake and release by the liver in vivo. Diabetes. 1999;48:1198–1214. - PubMed
-
- Lauro D, et al. Impaired glucose tolerance in mice with a targeted impairment of insulin action in muscle and adipose tissue. Nat Genet. 1998;20:294–298. - PubMed
-
- Michael MD, et al. Loss of insulin signaling in hepatocytes leads to severe insulin resistance and progressive hepatic dysfunction. Mol Cell. 2000;6:87–97. - PubMed
-
- Rother KI, et al. Evidence that IRS-2 phosphorylation is required for insulin action in hepatocytes. J Biol Chem. 1998;273:17491–17497. - PubMed
Publication types
MeSH terms
Substances
Grants and funding
LinkOut - more resources
Full Text Sources
Other Literature Sources
Molecular Biology Databases
Research Materials
Miscellaneous
