. 2001 Nov 5;194(9):1263-76.
doi: 10.1084/jem.194.9.1263.

Functional cloning of Src-like adapter protein-2 (SLAP-2), a novel inhibitor of antigen receptor signaling

Affiliations

Functional cloning of Src-like adapter protein-2 (SLAP-2), a novel inhibitor of antigen receptor signaling

S J Holland et al. J Exp Med. .

Abstract

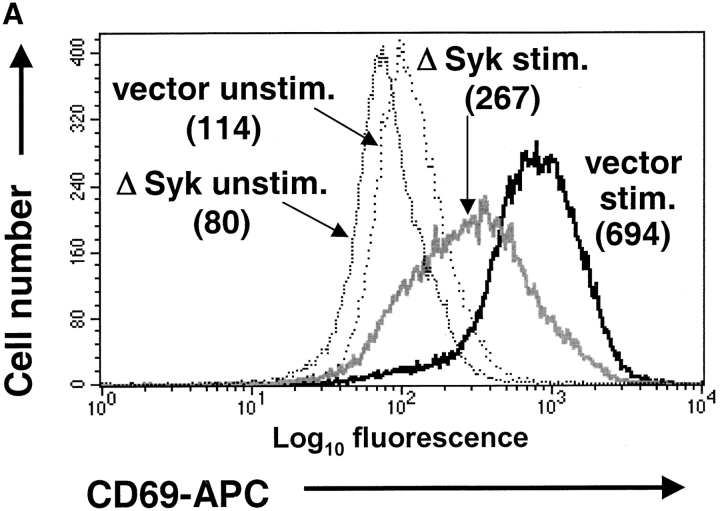
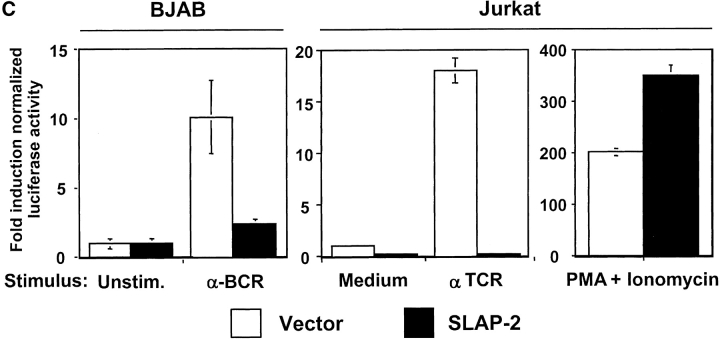
In an effort to identify novel therapeutic targets for autoimmunity and transplant rejection, we developed and performed a large-scale retroviral-based functional screen to select for proteins that inhibit antigen receptor-mediated activation of lymphocytes. In addition to known regulators of antigen receptor signaling, we identified a novel adaptor protein, SLAP-2 which shares 36% sequence similarity with the known Src-like adaptor protein, SLAP. Similar to SLAP, SLAP-2 is predominantly expressed in hematopoietic cells. Overexpression of SLAP-2 in B and T cell lines specifically impaired antigen receptor-mediated signaling events, including CD69 surface marker upregulation, nuclear factor of activated T cells (NFAT) promoter activation and calcium influx. Signaling induced by phorbol myristate acetate (PMA) and ionomycin was not significantly reduced, suggesting SLAP-2 functions proximally in the antigen receptor signaling cascade. The SLAP-2 protein contains an NH2-terminal myristoylation consensus sequence and SH3 and SH2 Src homology domains, but lacks a tyrosine kinase domain. In antigen receptor-stimulated cells, SLAP-2 associated with several tyrosine phosphorylated proteins, including the ubiquitin ligase Cbl. Deletion of the COOH terminus of SLAP-2 blocked function and abrogated its association with Cbl. Mutation of the putative myristoylation site of SLAP-2 compromised its inhibitory activity and impaired its localization to the membrane compartment. Our identification of the negative regulator SLAP-2 demonstrates that a retroviral-based screening strategy may be an efficient way to identify and characterize the function of key components of many signal transduction systems.


Figures

Figure 1.
Figure 1.
CD69 cell surface marker screen in BJAB cells. (A) Characterization of the tTA-BJAB cell line using dominant-negative ΔSyk. The tTA-BJAB cell line was infected with pTRA-IRES.GFP vector or a truncated, dominant negative version of Syk (ΔSyk) in the same vector. Cells were stimulated (stim.) with anti-IgM F(ab′)2 and stained for surface CD69 expression. In GFP-gated control cells, fivefold antigen-induced upregulation of CD69 expression over the basal level was achieved. Infection of ΔSyk reduced anti-IgM F(ab′)2-induced CD69 expression to 38% of the control value and also slightly depressed basal CD69 expression. Geometric mean values of CD69 fluorescence are shown in brackets. (B) Screening strategy. tTA BJAB cells stably infected with pTRA cDNA libraries were stimulated with anti-IgM F(ab′)2 and stained for CD69 surface expression. Cells expressing the lowest levels of antigen-induced CD69 were sorted, expanded, and resorted until significant enrichment of nonresponsive cells was observed. Single cell clones were deposited from several sorts and analyzed for anti-IgM F(ab′)2-induced CD69 upregulation in the absence (cDNA on) and presence (cDNA off) of dox. (C) Cell surface CD69 expression in representative positive cell clones. Unstimulated cells (dotted line) and cells stimulated with anti-IgM F(ab′)2 (solid line) were stained with APC-conjugated anti-CD69 antibody. Gray line: stimulated cells stained with isotype control-APC antibody. Inhibition of anti-IgMF(ab′)2-induced CD69 expression (top panel) by cDNAs in clones 584, 780, and G18 (containing spiked control Δsyk) is reversed when cells are grown in the presence of dox (cDNA off; bottom panel).
Figure 1.
Figure 1.
CD69 cell surface marker screen in BJAB cells. (A) Characterization of the tTA-BJAB cell line using dominant-negative ΔSyk. The tTA-BJAB cell line was infected with pTRA-IRES.GFP vector or a truncated, dominant negative version of Syk (ΔSyk) in the same vector. Cells were stimulated (stim.) with anti-IgM F(ab′)2 and stained for surface CD69 expression. In GFP-gated control cells, fivefold antigen-induced upregulation of CD69 expression over the basal level was achieved. Infection of ΔSyk reduced anti-IgM F(ab′)2-induced CD69 expression to 38% of the control value and also slightly depressed basal CD69 expression. Geometric mean values of CD69 fluorescence are shown in brackets. (B) Screening strategy. tTA BJAB cells stably infected with pTRA cDNA libraries were stimulated with anti-IgM F(ab′)2 and stained for CD69 surface expression. Cells expressing the lowest levels of antigen-induced CD69 were sorted, expanded, and resorted until significant enrichment of nonresponsive cells was observed. Single cell clones were deposited from several sorts and analyzed for anti-IgM F(ab′)2-induced CD69 upregulation in the absence (cDNA on) and presence (cDNA off) of dox. (C) Cell surface CD69 expression in representative positive cell clones. Unstimulated cells (dotted line) and cells stimulated with anti-IgM F(ab′)2 (solid line) were stained with APC-conjugated anti-CD69 antibody. Gray line: stimulated cells stained with isotype control-APC antibody. Inhibition of anti-IgMF(ab′)2-induced CD69 expression (top panel) by cDNAs in clones 584, 780, and G18 (containing spiked control Δsyk) is reversed when cells are grown in the presence of dox (cDNA off; bottom panel).
Figure 2.
Figure 2.
Cloning of a novel inhibitory adaptor, SLAP-2. (A) Human SLAP-2 cDNA sequence. The putative myristoylation site is shown in bold. Open and solid triangles indicate the boundaries of SH3 and SH2 domains, respectively. These sequence data are available from GenBank/EMBL/DDBJ under accession no. AF326353. (B) Alignment of human SLAP-2 and SLAP. Identical amino acids are boxed and highlighted. Open and solid triangles indicate the boundaries of SH3 and SH2 domains, respectively. The overall amino acid similarity between SLAP-2 and SLAP is 36%. In the SH2 and SH3 domains alone the similarity between SLAP-2 and SLAP is 48% and between SLAP-2 and the Src family kinase Hck is 45%. (C) Northern blot analysis of SLAP-2 expression. Left: human tissues and right: tumor cell lines including promyelocytic leukemia HL-60, HeLa cell S3, chronic myelogeneous leukemia K-562, lymphoblastic leukemia MOLT-4, Burkitt's lymphoma Raji, colorectal adenocarcinoma SW480, lung carcinoma A549, and melanoma G361. Blots were stripped and reprobed with an actin probe (bottom panel). (D) RT-PCR of SLAP-2 from purified human primary cells. Specific SLAP-2 primers or control GAPDH primers were used in a standard PCR reaction with cDNA templates obtained from resting (rest.) and activated (act.) CD4+ T cells (stimulated with PHA), CD19+ B cells (stimulated with pokeweed mitogen), or CD14+ monocytes (human blood fractions MTC panel [CLONTECH Laboratories, Inc.]).
Figure 2.
Figure 2.
Cloning of a novel inhibitory adaptor, SLAP-2. (A) Human SLAP-2 cDNA sequence. The putative myristoylation site is shown in bold. Open and solid triangles indicate the boundaries of SH3 and SH2 domains, respectively. These sequence data are available from GenBank/EMBL/DDBJ under accession no. AF326353. (B) Alignment of human SLAP-2 and SLAP. Identical amino acids are boxed and highlighted. Open and solid triangles indicate the boundaries of SH3 and SH2 domains, respectively. The overall amino acid similarity between SLAP-2 and SLAP is 36%. In the SH2 and SH3 domains alone the similarity between SLAP-2 and SLAP is 48% and between SLAP-2 and the Src family kinase Hck is 45%. (C) Northern blot analysis of SLAP-2 expression. Left: human tissues and right: tumor cell lines including promyelocytic leukemia HL-60, HeLa cell S3, chronic myelogeneous leukemia K-562, lymphoblastic leukemia MOLT-4, Burkitt's lymphoma Raji, colorectal adenocarcinoma SW480, lung carcinoma A549, and melanoma G361. Blots were stripped and reprobed with an actin probe (bottom panel). (D) RT-PCR of SLAP-2 from purified human primary cells. Specific SLAP-2 primers or control GAPDH primers were used in a standard PCR reaction with cDNA templates obtained from resting (rest.) and activated (act.) CD4+ T cells (stimulated with PHA), CD19+ B cells (stimulated with pokeweed mitogen), or CD14+ monocytes (human blood fractions MTC panel [CLONTECH Laboratories, Inc.]).
Figure 3.
Figure 3.
SLAP-2 inhibits antigen receptor signaling in B and T lymphocytes. Epitope-tagged SLAP-2 and SLAP cDNAs in the pTRA-IRES.GFP vector or vector alone were infected into tTA-BJAB or Jurkat cells. Surface CD69 expression was analyzed in stimulated GFP-negative (uninfected; dotted line) and GFP-positive (infected; solid line) cells by analytical gating. The geometric means of APC-CD69 fluorescence are shown for GFP-negative and GFP-positive cells. (A) tTA-BJAB cells stimulated with anti-IgM F(ab′)2 or PMA. Both SLAP-2 and SLAP significantly decrease anti-IgM F(ab′)2-induced but not PMA-induced CD69 expression compared with control. (B) tTA-Jurkat cells stimulated with C305 or PMA. Both SLAP-2 and SLAP significantly decrease C305-induced CD69 expression compared with control. (C) NFAT promoter activation is inhibited by SLAP-2. BJAB or Jurkat-TAg cells were transiently co-transfected with 40 μg pEFBOS-SLAP-2 or vector alone, plus an NFAT-Luciferase reporter construct. Cells were stimulated with anti-IgM F(ab′)2, C305, or PMA plus ionomycin for 12 h, and assayed for luciferase activity in triplicate. Fold induction of luciferase activity over the unstimulated, vector-transfected sample is shown. The basal luciferase activity for this experiment was ∼100 arbitrary light units (AU). The data are representative of several independent experiments. (D) Jurkat-TAg cells were transiently cotransfected with 1, 2, 4, 16, or 32 μg of SLAP-2 DNA and NFAT-Luciferase reporter construct, keeping the total DNA amount constant with empty vector. Cells were stimulated and luciferase assays were performed as above. Equal aliquots of cells were analyzed by anti-FLAG Western blot for SLAP-2 protein expression.
Figure 3.
Figure 3.
SLAP-2 inhibits antigen receptor signaling in B and T lymphocytes. Epitope-tagged SLAP-2 and SLAP cDNAs in the pTRA-IRES.GFP vector or vector alone were infected into tTA-BJAB or Jurkat cells. Surface CD69 expression was analyzed in stimulated GFP-negative (uninfected; dotted line) and GFP-positive (infected; solid line) cells by analytical gating. The geometric means of APC-CD69 fluorescence are shown for GFP-negative and GFP-positive cells. (A) tTA-BJAB cells stimulated with anti-IgM F(ab′)2 or PMA. Both SLAP-2 and SLAP significantly decrease anti-IgM F(ab′)2-induced but not PMA-induced CD69 expression compared with control. (B) tTA-Jurkat cells stimulated with C305 or PMA. Both SLAP-2 and SLAP significantly decrease C305-induced CD69 expression compared with control. (C) NFAT promoter activation is inhibited by SLAP-2. BJAB or Jurkat-TAg cells were transiently co-transfected with 40 μg pEFBOS-SLAP-2 or vector alone, plus an NFAT-Luciferase reporter construct. Cells were stimulated with anti-IgM F(ab′)2, C305, or PMA plus ionomycin for 12 h, and assayed for luciferase activity in triplicate. Fold induction of luciferase activity over the unstimulated, vector-transfected sample is shown. The basal luciferase activity for this experiment was ∼100 arbitrary light units (AU). The data are representative of several independent experiments. (D) Jurkat-TAg cells were transiently cotransfected with 1, 2, 4, 16, or 32 μg of SLAP-2 DNA and NFAT-Luciferase reporter construct, keeping the total DNA amount constant with empty vector. Cells were stimulated and luciferase assays were performed as above. Equal aliquots of cells were analyzed by anti-FLAG Western blot for SLAP-2 protein expression.
Figure 4.
Figure 4.
SLAP-2 represses antigen-induced calcium mobilization in BJAB and Jurkat cells BJAB and Jurkat cells stably expressing SLAP-2 were labeled with the calcium indicator indo-1. Cells were stimulated at 37°C on an LSR flow cytometer with UV laser, and analyzed by analytical gating on GFP. Ratio of bound/unbound indo-1 is shown over a 10-min time course. Broken line: GFP-negative cells; solid line: GFP-positive cells. (A) BJAB cells stimulated with anti-IgM F(ab′)2 followed by ionomycin. (B) Jurkat cells stimulated with C305 followed by ionomycin.
Figure 5.
Figure 5.
The NH2-terminal myristoylation site and COOH-terminal unique regions of SLAP-2 are required for inhibition of antigen receptor signaling. Epitope-tagged wild-type SLAP-2, SLAP-2-myr, and SLAP-2-ΔC in the pTRA-IRES.GFP vector were stably introduced into tTA-BJAB or tTA-Jurkat cells, and GFP-positive cells were enriched by sorting. Induced surface CD69 expression was analyzed in vector-infected cells (dotted line) and cells infected with wild-type or mutant SLAP-2 (solid line) with analytical-gating on GFP expression. The geometric means of APC-CD69 fluorescence is shown. (A) tTA-BJAB cells stimulated with anti-IgM F(ab′)2.Wild-type (WT) SLAP-2 reduced anti-IgM F(ab′)2-induced CD69 expression by ∼2-fold, whereas SLAP-2-myr and SLAP-2-ΔC resembled the vector control. Percentage of GFP positive cells: vector 91%; wild-type SLAP-2 89%; SLAP-2-myr 80%; SLAP-2-ΔC 87%. (B) tTA-Jurkat cells stimulated with C305. Wild-type SLAP-2 reduced C305-induced CD69 expression by ∼3-fold, whereas inhibition was compromised in cells expressing SLAP-2-myr and SLAP-2-ΔC. Percentage of GFP-positive cells: vector 84%; wild-type SLAP-2 46%; SLAP-2-myr 44%; SLAP-2-ΔC 45%. (C) Equal aliquots of infected tTA-BJAB cells were lysed and analyzed by anti-FLAG Western blot for SLAP-2 protein expression. (D) Equal aliquots of infected tTA-Jurkat cells were lysed and analyzed by anti-FLAG Western blot for SLAP-2 protein expression. (E) Membrane pellet (P) and soluble fraction (S) of wild-type SLAP-2 and SLAP-2-myr–infected tTA-BJAB cells were immunoprecipitated (top panel) or loaded directly (center bottom panels) and immunoblotted with antibodies raised against the FLAG epitope (top panel), the integral membrane protein CD40 (center panel), and the cytoplasmic protein JNK (bottom panel). A fraction of wild-type SLAP-2 but not SLAP-2-myr was localized in the membrane fraction.
Figure 5.
Figure 5.
The NH2-terminal myristoylation site and COOH-terminal unique regions of SLAP-2 are required for inhibition of antigen receptor signaling. Epitope-tagged wild-type SLAP-2, SLAP-2-myr, and SLAP-2-ΔC in the pTRA-IRES.GFP vector were stably introduced into tTA-BJAB or tTA-Jurkat cells, and GFP-positive cells were enriched by sorting. Induced surface CD69 expression was analyzed in vector-infected cells (dotted line) and cells infected with wild-type or mutant SLAP-2 (solid line) with analytical-gating on GFP expression. The geometric means of APC-CD69 fluorescence is shown. (A) tTA-BJAB cells stimulated with anti-IgM F(ab′)2.Wild-type (WT) SLAP-2 reduced anti-IgM F(ab′)2-induced CD69 expression by ∼2-fold, whereas SLAP-2-myr and SLAP-2-ΔC resembled the vector control. Percentage of GFP positive cells: vector 91%; wild-type SLAP-2 89%; SLAP-2-myr 80%; SLAP-2-ΔC 87%. (B) tTA-Jurkat cells stimulated with C305. Wild-type SLAP-2 reduced C305-induced CD69 expression by ∼3-fold, whereas inhibition was compromised in cells expressing SLAP-2-myr and SLAP-2-ΔC. Percentage of GFP-positive cells: vector 84%; wild-type SLAP-2 46%; SLAP-2-myr 44%; SLAP-2-ΔC 45%. (C) Equal aliquots of infected tTA-BJAB cells were lysed and analyzed by anti-FLAG Western blot for SLAP-2 protein expression. (D) Equal aliquots of infected tTA-Jurkat cells were lysed and analyzed by anti-FLAG Western blot for SLAP-2 protein expression. (E) Membrane pellet (P) and soluble fraction (S) of wild-type SLAP-2 and SLAP-2-myr–infected tTA-BJAB cells were immunoprecipitated (top panel) or loaded directly (center bottom panels) and immunoblotted with antibodies raised against the FLAG epitope (top panel), the integral membrane protein CD40 (center panel), and the cytoplasmic protein JNK (bottom panel). A fraction of wild-type SLAP-2 but not SLAP-2-myr was localized in the membrane fraction.
Figure 6.
Figure 6.
SLAP-2 associates with tyrosine phosphorylated proteins including Cbl after antigen stimulation. (A) SLAP-2 associates with tyrosine phosphorylated proteins in B cells. Sorted tTA-BJAB cells infected with epitope-tagged wild-type (WT) SLAP-2, SLAP-2-myr, or SLAP-2-ΔC were stimulated with anti-IgM F(ab′)2 for 2 min, lysed, and SLAP-2 was immunoprecipitated using anti-FLAG agarose. Immunoprecipitated proteins were subjected to SDS-PAGE and immunoblotted with anti-phosphotyrosine antibodies. SLAP-2 associates with tyrosine phosphorylated proteins of ∼110 and 70 kD after antigen stimulation. The ΔC mutant lacks the 110 kD SLAP-2-associated phosphoprotein. Bottom panel: reprobe with anti-FLAG. (B) SLAP-2 interacts with Cbl in B cells. Wild-type SLAP-2, SLAP-2-myr, or SLAP-2-ΔC were immunoprecipitated as in (A) and immunoblotted with anti-Cbl antibodies. Wild-type SLAP-2 and SLAP-2-myr but not SLAP-2-ΔC associate with Cbl after antigen stimulation.
Figure 6.
Figure 6.
SLAP-2 associates with tyrosine phosphorylated proteins including Cbl after antigen stimulation. (A) SLAP-2 associates with tyrosine phosphorylated proteins in B cells. Sorted tTA-BJAB cells infected with epitope-tagged wild-type (WT) SLAP-2, SLAP-2-myr, or SLAP-2-ΔC were stimulated with anti-IgM F(ab′)2 for 2 min, lysed, and SLAP-2 was immunoprecipitated using anti-FLAG agarose. Immunoprecipitated proteins were subjected to SDS-PAGE and immunoblotted with anti-phosphotyrosine antibodies. SLAP-2 associates with tyrosine phosphorylated proteins of ∼110 and 70 kD after antigen stimulation. The ΔC mutant lacks the 110 kD SLAP-2-associated phosphoprotein. Bottom panel: reprobe with anti-FLAG. (B) SLAP-2 interacts with Cbl in B cells. Wild-type SLAP-2, SLAP-2-myr, or SLAP-2-ΔC were immunoprecipitated as in (A) and immunoblotted with anti-Cbl antibodies. Wild-type SLAP-2 and SLAP-2-myr but not SLAP-2-ΔC associate with Cbl after antigen stimulation.

Similar articles

Cited by

References

    1. Weiss, A., and D.R. Littman. 1994. Signal transduction by lymphocyte antigen receptors. Cell. 76:263–274. - PubMed
    1. DeFranco, A.L. 1997. The complexity of signaling pathways activated by the BCR. Curr. Opin. Immunol. 9:296–308. - PubMed
    1. Bolen, J.B. 1995. Protein tyrosine kinases in the initiation of antigen receptor signaling. Curr. Opin. Immunol. 7:306–311. - PubMed
    1. Kurosaki, T. 2000. Functional dissection of BCR signaling pathways. Curr. Opin. Immunol. 12:276–281. - PubMed
    1. Kelly, M.E., and A.C. Chan. 2000. Regulation of B cell function by linker proteins. Curr. Opin. Immunol. 12:267–275. - PubMed

MeSH terms

Substances