

Increased turnover of T lymphocytes in HIV-1 infection and its reduction by antiretroviral therapy
- PMID: 11696593
- PMCID: PMC2195973
- DOI: 10.1084/jem.194.9.1277
Increased turnover of T lymphocytes in HIV-1 infection and its reduction by antiretroviral therapy
Abstract
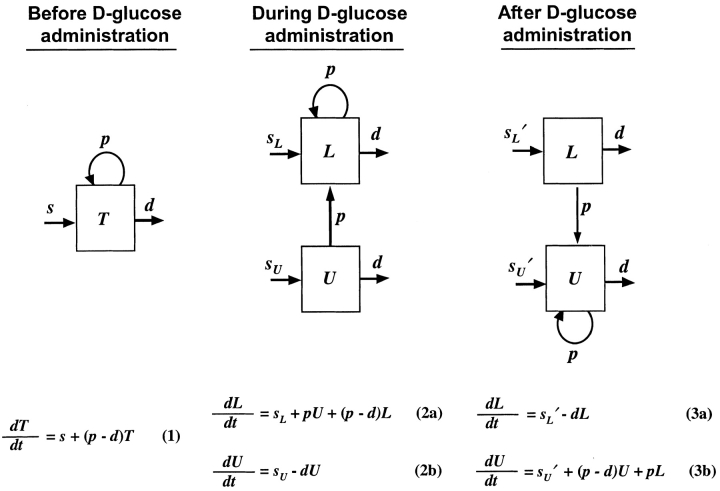
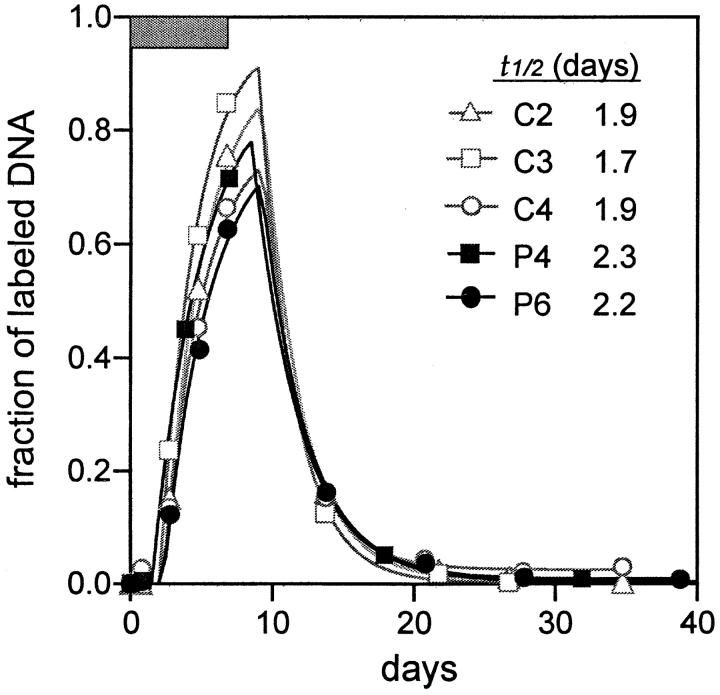
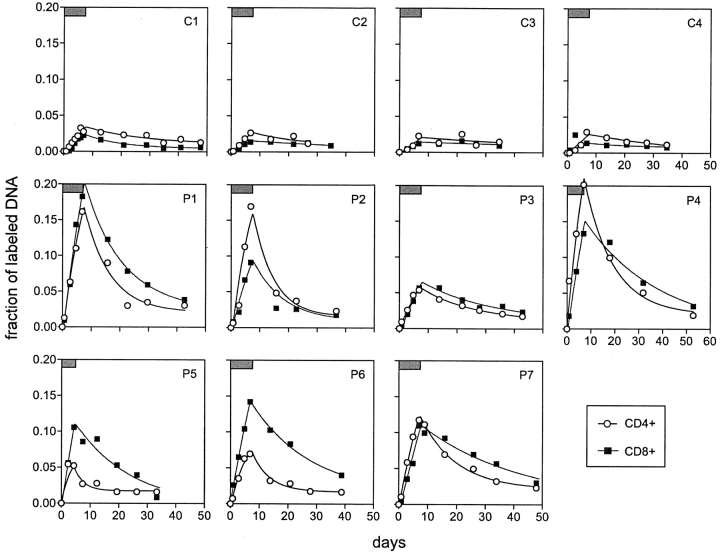
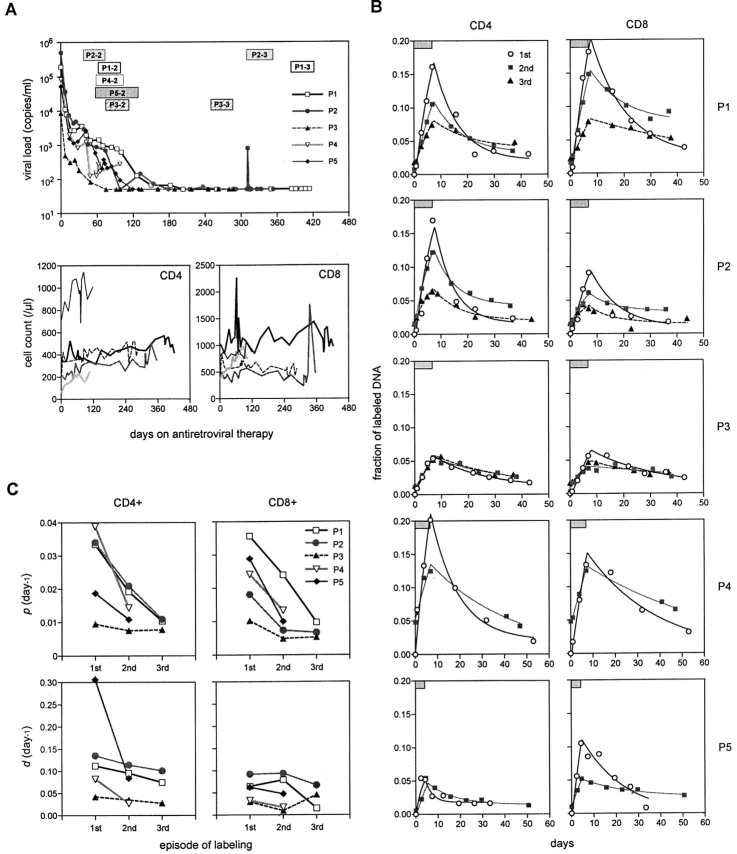
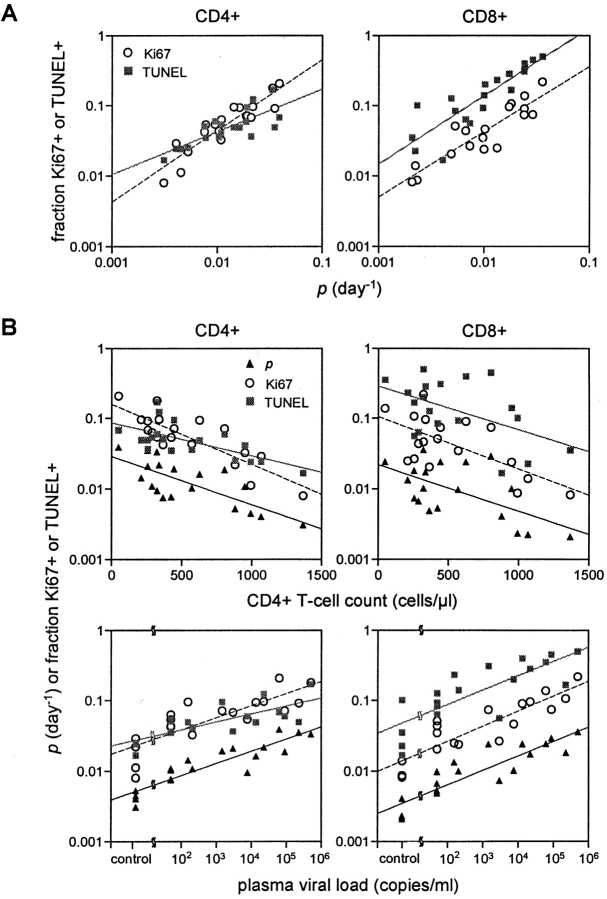
The mechanism of CD4(+) T cell depletion in human immunodeficiency virus (HIV)-1 infection remains controversial. Using deuterated glucose to label the DNA of proliferating cells in vivo, we studied T cell dynamics in four normal subjects and seven HIV-1-infected patients naive to antiretroviral drugs. The results were analyzed using a newly developed mathematical model to determine fractional rates of lymphocyte proliferation and death. In CD4(+) T cells, mean proliferation and death rates were elevated by 6.3- and 2.9-fold, respectively, in infected patients compared with normal controls. In CD8(+) T cells, the mean proliferation rate was 7.7-fold higher in HIV-1 infection, but the mean death rate was not significantly increased. Five of the infected patients underwent subsequent deuterated glucose labeling studies after initiating antiretroviral therapy. The lymphocyte proliferation and death rates in both CD4(+) and CD8(+) cell populations were substantially reduced by 5-11 weeks and nearly normal by one year. Taken together, these new findings strongly indicate that CD4(+) lymphocyte depletion seen in AIDS is primarily a consequence of increased cellular destruction, not decreased cellular production.
Figures
Similar articles
-
T-cell division in human immunodeficiency virus (HIV)-1 infection is mainly due to immune activation: a longitudinal analysis in patients before and during highly active antiretroviral therapy (HAART).Blood. 2000 Jan 1;95(1):249-55. Blood. 2000. PMID: 10607709 Clinical Trial.
-
In vivo dynamics of T cell activation, proliferation, and death in HIV-1 infection: why are CD4+ but not CD8+ T cells depleted?Proc Natl Acad Sci U S A. 2002 Nov 26;99(24):15572-7. doi: 10.1073/pnas.242358099. Epub 2002 Nov 14. Proc Natl Acad Sci U S A. 2002. PMID: 12434018 Free PMC article.
-
Normalization of CD4+ cell numbers and reduced levels of memory CD8+ cells in blood and tonsillar tissue after highly active antiretroviral therapy in early HIV type-1 infection.AIDS Res Hum Retroviruses. 2000 Feb 10;16(3):191-201. doi: 10.1089/088922200309287. AIDS Res Hum Retroviruses. 2000. PMID: 10710207
-
Comparative Proliferation Capacity of Gag-C-Specific Naive and Memory CD4+ and CD8+ T Lymphocytes in Rapid, Viremic Slow, and Slow Progressors During Human Immunodeficiency Virus Infection.Viral Immunol. 2018 Sep;31(7):513-524. doi: 10.1089/vim.2018.0012. Epub 2018 Aug 29. Viral Immunol. 2018. PMID: 30156469
-
Combined Env- and Gag-specific T cell responses in relation to programmed death-1 receptor and CD4 T cell loss rates in human immunodeficiency virus-1 infection.Clin Exp Immunol. 2010 Aug;161(2):315-23. doi: 10.1111/j.1365-2249.2010.04179.x. Epub 2010 May 10. Clin Exp Immunol. 2010. PMID: 20491784 Free PMC article.
Cited by
-
Personalized Immunotherapy Treatment Strategies for a Dynamical System of Chronic Myelogenous Leukemia.Cancers (Basel). 2021 Apr 22;13(9):2030. doi: 10.3390/cancers13092030. Cancers (Basel). 2021. PMID: 33922302 Free PMC article.
-
The efficiency of the human CD8+ T cell response: how should we quantify it, what determines it, and does it matter?PLoS Comput Biol. 2012;8(2):e1002381. doi: 10.1371/journal.pcbi.1002381. Epub 2012 Feb 23. PLoS Comput Biol. 2012. PMID: 22383867 Free PMC article.
-
Differentiation Kinetics of Blood Monocytes and Dendritic Cells in Macaques: Insights to Understanding Human Myeloid Cell Development.J Immunol. 2015 Aug 15;195(4):1774-81. doi: 10.4049/jimmunol.1500522. Epub 2015 Jul 15. J Immunol. 2015. PMID: 26179903 Free PMC article.
-
Single-Cell and Single-Cycle Analysis of HIV-1 Replication.PLoS Pathog. 2015 Jun 18;11(6):e1004961. doi: 10.1371/journal.ppat.1004961. eCollection 2015 Jun. PLoS Pathog. 2015. PMID: 26086614 Free PMC article.
-
The replication-competent HIV-1 latent reservoir is primarily established near the time of therapy initiation.Sci Transl Med. 2019 Oct 9;11(513):eaaw5589. doi: 10.1126/scitranslmed.aaw5589. Sci Transl Med. 2019. PMID: 31597754 Free PMC article.
References
-
- Wei, X., S.K. Ghosh, M.E. Taylor, V.A. Johnson, E.A. Emini, P. Deutsch, J.D. Lifson, S. Bonhoeffer, M.A. Nowak, B.H. Hahn, et al. 1995. Viral dynamics in human immunodeficiency virus type 1 infection. Nature. 373:117–122. - PubMed
-
- Ho, D.D., A.U. Neumann, A.S. Perelson, W. Chen, J.M. Leonard, and M. Markowitz. 1995. Rapid turnover of plasma virions and CD4 lymphocytes in HIV-1 infection. Nature. 373:123–126. - PubMed
-
- Sprent, J., and D. Tough. 1995. HIV results in the frame (CD4+ cell turnover). Nature. 375:198. - PubMed
-
- Wolthers, K.C., G. Bea, A. Wisman, S.A. Otto, A.M. de Roda Husman, N. Schaft, F. de Wolf, J. Goudsmit, R.A. Coutinho, A.G. van der Zee, et al. 1996. T cell telomere length in HIV-1 infection: no evidence for increased CD4+ T cell turnover. Science. 274:1543–1547. - PubMed
Publication types
MeSH terms
Substances
Grants and funding
LinkOut - more resources
Full Text Sources
Other Literature Sources
Medical
Research Materials
