. 2001 Nov 5;194(9):1349-59.
doi: 10.1084/jem.194.9.1349.

Hyper immunoglobulin E response in mice with monoclonal populations of B and T lymphocytes

Affiliations

Hyper immunoglobulin E response in mice with monoclonal populations of B and T lymphocytes

M A Curotto de Lafaille et al. J Exp Med. .

Abstract

A key event in the pathogenesis of allergies is the production of antibodies of the immunoglobulin (Ig)E class. In normal individuals the levels of IgE are tightly regulated, as illustrated by the low serum IgE concentration. In addition, multiple immunizations are usually required to generate detectable IgE responses in normal experimental animals. To define the parameters that regulate IgE production in vivo, we generated mice bearing monoclonal populations of B and T lymphocytes specific for influenza virus hemagglutinin (HA) and chicken ovalbumin (OVA), respectively. A single immunization of the monoclonal mice with the cross-linked OVA-HA antigen led to serum IgE levels that reached 30-200 microg/ml. This unusually high IgE response was prevented by the infusion of regulatory alpha/beta CD4(+) T cells belonging to both CD25(+) and CD25(-) subpopulations. The regulation by the infused T cells impeded the development of fully competent OVA-specific effector/memory Th2 lymphocytes without inhibiting the initial proliferative response of T cells or promoting activation-induced cell death. Our results indicate that hyper IgE responses do not occur in normal individuals due to the presence of regulatory T cells, and imply that the induction of regulatory CD4(+) T cells could be used for the prevention of atopy.


Figures

Figure 1.
Figure 1.
Generation of 17/9 homologous replacement mice. (A and B) Schematic representation of the targeting of the 17/9 antibody genes into A: the heavy chain, and B: the κ light chain immunoglobulin loci. 1: germline loci; 2: targeting vectors; 3: targeted loci. J genes (JH and Jκ), μ switch region (Sμ), μ enhancer (Eμ), and κ and μ constant regions (Cκ and Cμ, respectively) are indicated. Neo-loxP indicates the lox-P flanked neomycin resistance cassette. Restriction sites: B, BamHI; C, Cla I; E, EcoRI; H, HindIII; M, MfeI; S, SmaI; X, XhoI. (C) Southern analysis of Mfe I-digested DNA from 17/9 VDJ heavy chain gene targeted ES clones before (R11 clone) and after (F3 and A9 clones) cre-mediated deletion of the neo-loxP cassette. The filter was hybridized to probe A in panel A. DNA from the untargeted J1 ES cell line is also shown. (D) Southern analysis of VJ 17/9 κ light chain targeted ES clones. BamHI/EcoRI double-digested DNA was hybridized to probe D in B. Targeted clones before (V11) and after (B1) deletion of the neo-loxP cassette. J1: untargeted ES cell line.
Figure 1.
Figure 1.
Generation of 17/9 homologous replacement mice. (A and B) Schematic representation of the targeting of the 17/9 antibody genes into A: the heavy chain, and B: the κ light chain immunoglobulin loci. 1: germline loci; 2: targeting vectors; 3: targeted loci. J genes (JH and Jκ), μ switch region (Sμ), μ enhancer (Eμ), and κ and μ constant regions (Cκ and Cμ, respectively) are indicated. Neo-loxP indicates the lox-P flanked neomycin resistance cassette. Restriction sites: B, BamHI; C, Cla I; E, EcoRI; H, HindIII; M, MfeI; S, SmaI; X, XhoI. (C) Southern analysis of Mfe I-digested DNA from 17/9 VDJ heavy chain gene targeted ES clones before (R11 clone) and after (F3 and A9 clones) cre-mediated deletion of the neo-loxP cassette. The filter was hybridized to probe A in panel A. DNA from the untargeted J1 ES cell line is also shown. (D) Southern analysis of VJ 17/9 κ light chain targeted ES clones. BamHI/EcoRI double-digested DNA was hybridized to probe D in B. Targeted clones before (V11) and after (B1) deletion of the neo-loxP cassette. J1: untargeted ES cell line.
Figure 3.
Figure 3.
Development of hyper IgE can be prevented by normal TCR α/β+CD4+ splenocytes. (A) Total (2.5 × 10⁷) or fractionated spleen cells (CD4-depleted, CD8-depleted, B220-depleted: 2 × 10⁷) from wild-type BALB/c mice or total spleen cells from TCR α−/− mice (2 × 10⁷) were transferred into 17/9 DO11.10 RAG−/− recipients 1 d before immunization. Total IgE serum levels were determined 14 d after immunization. n = 6–8 mice per group. (B) Purified spleen cells populations obtained from wild-type BALB/c mice or BALB/c μMT−/− mice were transferred to 17/9 DO11.10 RAG−/− recipients one day before immunization. Serum IgE levels were determined 19 d after immunization. Exp 1: three cell populations were obtained from wild-type BALB/c donors and transferred: (1) purified CD4+CD25+ spleen cells (6 × 10⁵); (2) spleen cells depleted of B220+, CD8+, and CD25+ lymphocytes (6 × 10⁵ or 3 × 10⁶ CD4+CD25 cells transferred); (3) spleen cells depleted of B220+ and CD8+ lymphocytes (6 × 10⁵ or 3 × 10⁶ total CD4+ T cells transferred). Exp 2: purified CD4+CD25+ spleen cells, and spleen cells depleted of CD25+ cells were obtained from BALB/c μMT−/− donors and transferred in doses of 5 × 10⁵ or 105 CD4+ T cells. Exp 3: CD4+CD25+ and CD4+CD25 donor spleen cells were obtained from BALB/c μMT−/− donors. To purify CD4+CD25 cells, spleen cells were first depleted of CD25+ cells. Subsequently, CD4+ cells were positively sorted. (C) Typical FACS® profiles of purified donor populations are shown. Dot plots contain the profiles of cells in a broad FSC/SSC lymphocyte gate. The three plots on the left show donor cells from Exp 2. The plot on the right shows purified CD4+CD25 cells from Exp 3.
Figure 3.
Figure 3.
Development of hyper IgE can be prevented by normal TCR α/β+CD4+ splenocytes. (A) Total (2.5 × 10⁷) or fractionated spleen cells (CD4-depleted, CD8-depleted, B220-depleted: 2 × 10⁷) from wild-type BALB/c mice or total spleen cells from TCR α−/− mice (2 × 10⁷) were transferred into 17/9 DO11.10 RAG−/− recipients 1 d before immunization. Total IgE serum levels were determined 14 d after immunization. n = 6–8 mice per group. (B) Purified spleen cells populations obtained from wild-type BALB/c mice or BALB/c μMT−/− mice were transferred to 17/9 DO11.10 RAG−/− recipients one day before immunization. Serum IgE levels were determined 19 d after immunization. Exp 1: three cell populations were obtained from wild-type BALB/c donors and transferred: (1) purified CD4+CD25+ spleen cells (6 × 10⁵); (2) spleen cells depleted of B220+, CD8+, and CD25+ lymphocytes (6 × 10⁵ or 3 × 10⁶ CD4+CD25 cells transferred); (3) spleen cells depleted of B220+ and CD8+ lymphocytes (6 × 10⁵ or 3 × 10⁶ total CD4+ T cells transferred). Exp 2: purified CD4+CD25+ spleen cells, and spleen cells depleted of CD25+ cells were obtained from BALB/c μMT−/− donors and transferred in doses of 5 × 10⁵ or 105 CD4+ T cells. Exp 3: CD4+CD25+ and CD4+CD25 donor spleen cells were obtained from BALB/c μMT−/− donors. To purify CD4+CD25 cells, spleen cells were first depleted of CD25+ cells. Subsequently, CD4+ cells were positively sorted. (C) Typical FACS® profiles of purified donor populations are shown. Dot plots contain the profiles of cells in a broad FSC/SSC lymphocyte gate. The three plots on the left show donor cells from Exp 2. The plot on the right shows purified CD4+CD25 cells from Exp 3.
Figure 2.
Figure 2.
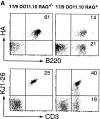
Hyper IgE production in mice with monoclonal populations of B and T lymphocytes. (A) HA-specific B cells and OVA-specific (KJ1–26+) T cells in 17/9 DO11.10 RAG−/− mice (plots on left) and 17/9 DO11.10 RAG+ mice (plots on right). FACS® analysis of peripheral blood lymphocytes from 4-wk-old mice. Only 10% of the CD3+ KJ1–26 T cells are CD8+, comprising less than 2% of the FSC × SSC lymphocyte gate. (B) Total serum IgE levels 14 d after single immunization. n = 7 mice per group. (C) Ratios of HA-specific serum immunoglobulin titers in sera of 17/9 DO11.10 RAG−/− and 17/9 DO11.10 RAG+ mice 14 d after single immunization. n = 7 mice per group. (D) T cells determine the hyper IgE phenotype. 5 × 10⁶ spleen cells from 17/9 RAG−/− mice (containing monoclonal anti-HA B cells) were transferred into DO11.10 RAG−/− mice (left bar), DO11.10 μMT−/− mice (middle bar), and DO11.10 RAG+μMT+ mice (right bar) 3 d after single immunization. The graphic shows total IgE levels in sera of mice on day 14 after immunization. n = 3 to 4 mice per group.
Figure 2.
Figure 2.
Hyper IgE production in mice with monoclonal populations of B and T lymphocytes. (A) HA-specific B cells and OVA-specific (KJ1–26+) T cells in 17/9 DO11.10 RAG−/− mice (plots on left) and 17/9 DO11.10 RAG+ mice (plots on right). FACS® analysis of peripheral blood lymphocytes from 4-wk-old mice. Only 10% of the CD3+ KJ1–26 T cells are CD8+, comprising less than 2% of the FSC × SSC lymphocyte gate. (B) Total serum IgE levels 14 d after single immunization. n = 7 mice per group. (C) Ratios of HA-specific serum immunoglobulin titers in sera of 17/9 DO11.10 RAG−/− and 17/9 DO11.10 RAG+ mice 14 d after single immunization. n = 7 mice per group. (D) T cells determine the hyper IgE phenotype. 5 × 10⁶ spleen cells from 17/9 RAG−/− mice (containing monoclonal anti-HA B cells) were transferred into DO11.10 RAG−/− mice (left bar), DO11.10 μMT−/− mice (middle bar), and DO11.10 RAG+μMT+ mice (right bar) 3 d after single immunization. The graphic shows total IgE levels in sera of mice on day 14 after immunization. n = 3 to 4 mice per group.
Figure 4.
Figure 4.
Analysis of activation of OVA-specific T cells. (A) Variation in KJ1–26+CD4+ lymphocyte number in spleens of 17/9 DO11.10 immunized mice. Mean and SD of groups of three mice per time-point are shown. Filled diamonds: 17/9 DO11.10 RAG−/− mice; filled triangles: 17/9 DO11.10 RAG−/− mice transferred with 2 × 10⁷ normal splenocytes; filled squares: 17/9 DO11.10 RAG+ mice. (B) CD25 expression in KJ1–26+CD4+ lymphocytes is not affected by regulatory lymphocytes. FACS® histogram profiles of KJ1–26+CD4+ gated spleen cells from 17/9 DO11.10 RAG−/− mice (No transfer) and 17/9 DO11.10 RAG−/− mice that were transferred with 2 × 10⁷ normal spleen cells one day before immunization (Tr. Normal Spl.). (C) Analysis of cell division of OVA-specific CD4+ lymphocytes. Spleen cells from DO11.10 RAG−/− mice (which contain monoclonal anti-OVA T cells) were labeled with CFSE and transferred (106 OVA-specific T cells) alone or together with unlabeled 2 × 10⁷ normal splenocytes, into 17/9 DO11.10 RAG−/− mice. Recipient mice were immunized 1 d after transfer. Cell division of transferred cells in the spleen was analyzed at several times after immunization. The top three panels illustrate the gating of KJ1–26+CD4+CFSE+ cells and the determination of CFSE intensity intervals defined by CFSE fluorescence peaks (1 to 6, with peak 6 representing T cells that did not divide). The bottom three panels show the distribution of KJ1–26+CD4+ CFSE+ cells (as percentage of total KJ1–26+CD4+ CFSE+) into CFSE fluorescence intervals (numbers 1 to 6 in top panel). Filled diamonds: 17/9 DO11.10 RAG−/− mice; filled triangles: 17/9 DO11.10 RAG−/− mice transferred with 2 × 10⁷ normal splenocytes.
Figure 4.
Figure 4.
Analysis of activation of OVA-specific T cells. (A) Variation in KJ1–26+CD4+ lymphocyte number in spleens of 17/9 DO11.10 immunized mice. Mean and SD of groups of three mice per time-point are shown. Filled diamonds: 17/9 DO11.10 RAG−/− mice; filled triangles: 17/9 DO11.10 RAG−/− mice transferred with 2 × 10⁷ normal splenocytes; filled squares: 17/9 DO11.10 RAG+ mice. (B) CD25 expression in KJ1–26+CD4+ lymphocytes is not affected by regulatory lymphocytes. FACS® histogram profiles of KJ1–26+CD4+ gated spleen cells from 17/9 DO11.10 RAG−/− mice (No transfer) and 17/9 DO11.10 RAG−/− mice that were transferred with 2 × 10⁷ normal spleen cells one day before immunization (Tr. Normal Spl.). (C) Analysis of cell division of OVA-specific CD4+ lymphocytes. Spleen cells from DO11.10 RAG−/− mice (which contain monoclonal anti-OVA T cells) were labeled with CFSE and transferred (106 OVA-specific T cells) alone or together with unlabeled 2 × 10⁷ normal splenocytes, into 17/9 DO11.10 RAG−/− mice. Recipient mice were immunized 1 d after transfer. Cell division of transferred cells in the spleen was analyzed at several times after immunization. The top three panels illustrate the gating of KJ1–26+CD4+CFSE+ cells and the determination of CFSE intensity intervals defined by CFSE fluorescence peaks (1 to 6, with peak 6 representing T cells that did not divide). The bottom three panels show the distribution of KJ1–26+CD4+ CFSE+ cells (as percentage of total KJ1–26+CD4+ CFSE+) into CFSE fluorescence intervals (numbers 1 to 6 in top panel). Filled diamonds: 17/9 DO11.10 RAG−/− mice; filled triangles: 17/9 DO11.10 RAG−/− mice transferred with 2 × 10⁷ normal splenocytes.
Figure 5.
Figure 5.
Effector/memory Th2 development and germinal center formation are inhibited by regulatory lymphocytes. (A) Cytokine production by OVA-specific T cells after immunization. Spleen cells from 17/9 DO11.10 RAG−/− immunized mice (No transfer) or 17/9 DO11.10 RAG−/− mice that were transferred with 2 × 10⁷ normal spleen cells one day before immunization (Tr. Normal Spl.) were analyzed for the production of IL-4 and IFN-γ by intracellular staining. Cells were stimulated in vitro with OVA peptide and processed as described in Materials and Methods. The graphic shows anti–IL-4 and anti–IFN-γ plots of KJ1–26+CD4+ gated spleen cells. Unimmunized mice display less than 0.1% of KJ1–26+CD4+ positive cells with either anti–IL-4 or anti–IFN-γ antibodies and no detectable population of IL-4+IFN-γ+ double-positive cells. (B) CD44/CD45RB staining of KJ1–26+CD4+ gated spleen cells from 17/9 DO11.10 RAG−/− immunized mice (No transfer) or 17/9 DO11.10 RAG−/− mice that were transferred with 2 × 10⁷ normal spleen cells one day before immunization (Tr. Normal Spl.). Unimmunized controls analyzed simultaneously as day 14 samples are also shown. (C) Decreased number of PNA+ cells in 17/9D011.10 RAG−/− mice transferred with normal splenocytes. PNA/HA staining is shown for B220+ gated splenocytes from 17/9 DO11.10 RAG−/− mice (No transfer) and from 17/9 DO11.10 RAG−/− mice that were transferred with 2 × 10⁷ normal spleen cells (Tr. Normal Spl.). Unimmunized controls analyzed simultaneously with the 10-d immunization samples are also shown. As expected, germinal center B cells showed downregulation of the B cell receptor.
Figure 5.
Figure 5.
Effector/memory Th2 development and germinal center formation are inhibited by regulatory lymphocytes. (A) Cytokine production by OVA-specific T cells after immunization. Spleen cells from 17/9 DO11.10 RAG−/− immunized mice (No transfer) or 17/9 DO11.10 RAG−/− mice that were transferred with 2 × 10⁷ normal spleen cells one day before immunization (Tr. Normal Spl.) were analyzed for the production of IL-4 and IFN-γ by intracellular staining. Cells were stimulated in vitro with OVA peptide and processed as described in Materials and Methods. The graphic shows anti–IL-4 and anti–IFN-γ plots of KJ1–26+CD4+ gated spleen cells. Unimmunized mice display less than 0.1% of KJ1–26+CD4+ positive cells with either anti–IL-4 or anti–IFN-γ antibodies and no detectable population of IL-4+IFN-γ+ double-positive cells. (B) CD44/CD45RB staining of KJ1–26+CD4+ gated spleen cells from 17/9 DO11.10 RAG−/− immunized mice (No transfer) or 17/9 DO11.10 RAG−/− mice that were transferred with 2 × 10⁷ normal spleen cells one day before immunization (Tr. Normal Spl.). Unimmunized controls analyzed simultaneously as day 14 samples are also shown. (C) Decreased number of PNA+ cells in 17/9D011.10 RAG−/− mice transferred with normal splenocytes. PNA/HA staining is shown for B220+ gated splenocytes from 17/9 DO11.10 RAG−/− mice (No transfer) and from 17/9 DO11.10 RAG−/− mice that were transferred with 2 × 10⁷ normal spleen cells (Tr. Normal Spl.). Unimmunized controls analyzed simultaneously with the 10-d immunization samples are also shown. As expected, germinal center B cells showed downregulation of the B cell receptor.

References

    1. Corry, D.B., and F. Kheradmand. 1999. Induction and regulation of the IgE response. Nature. 402:B18–B23. - PubMed
    1. Chilosi, M., F. Facchetti, L.D. Notarangelo, S. Romagnani, G. Del Prete, F. Almerigogna, M. De Carli, and G. Pizzolo. 1996. CD30 cell expression and abnormal soluble CD30 serum accumulation in Omenn's syndrome: evidence for a T helper 2-mediated condition. Eur. J. Immunol. 26:329–334. - PubMed
    1. Notarangelo, L.D., A. Villa, and K. Schwarz. 1999. RAG and RAG defects. Curr. Opin. Immunol. 11:435–442. - PubMed
    1. Grimbacher, B., S.M. Holland, J.I. Gallin, F. Greenberg, S.C. Hill, H.L. Malech, J.A. Miller, A.C. O'Connell, and J.M. Puck. 1999. Hyper-IgE syndrome with recurrent infections—an autosomal dominant multisystem disorder. N. Engl. J. Med. 340:692–702. - PubMed
    1. Lucey, D.R., R.A. Zajac, G.P. Melcher, C.A. Butzin, and R.N. Boswell. 1990. Serum IgE levels in 622 persons with human immunodeficiency virus infection: IgE elevation with marked depletion of CD4+ T-cells. AIDS Res. Hum. Retrovir. 6:427–429. - PubMed

Publication types