

Mapping continued brain growth and gray matter density reduction in dorsal frontal cortex: Inverse relationships during postadolescent brain maturation
- PMID: 11698594
- PMCID: PMC6762261
- DOI: 10.1523/JNEUROSCI.21-22-08819.2001
Mapping continued brain growth and gray matter density reduction in dorsal frontal cortex: Inverse relationships during postadolescent brain maturation
Abstract
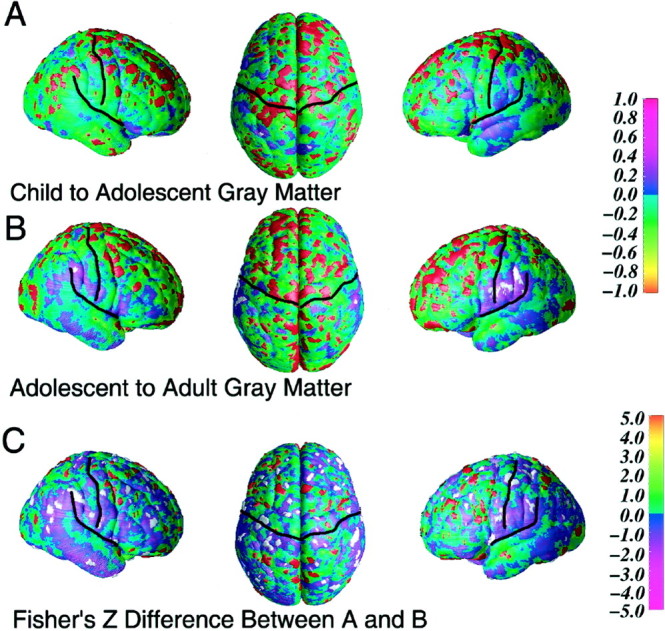
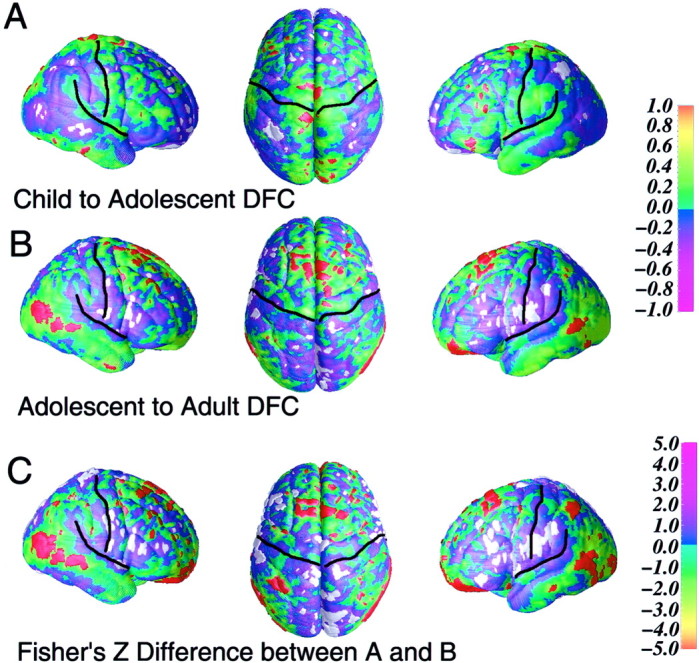
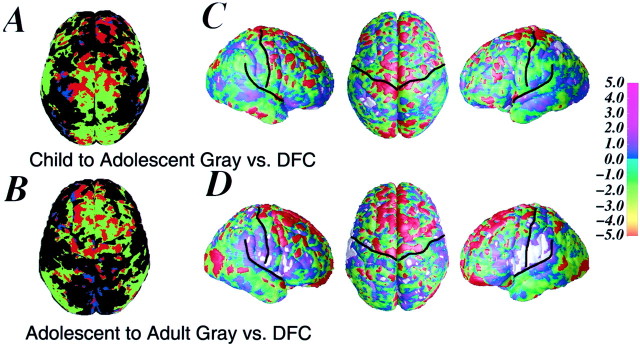
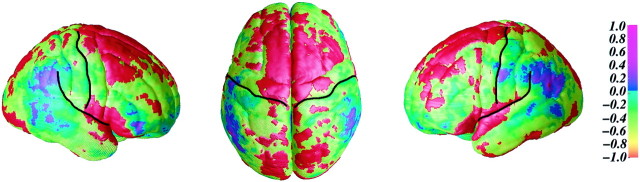
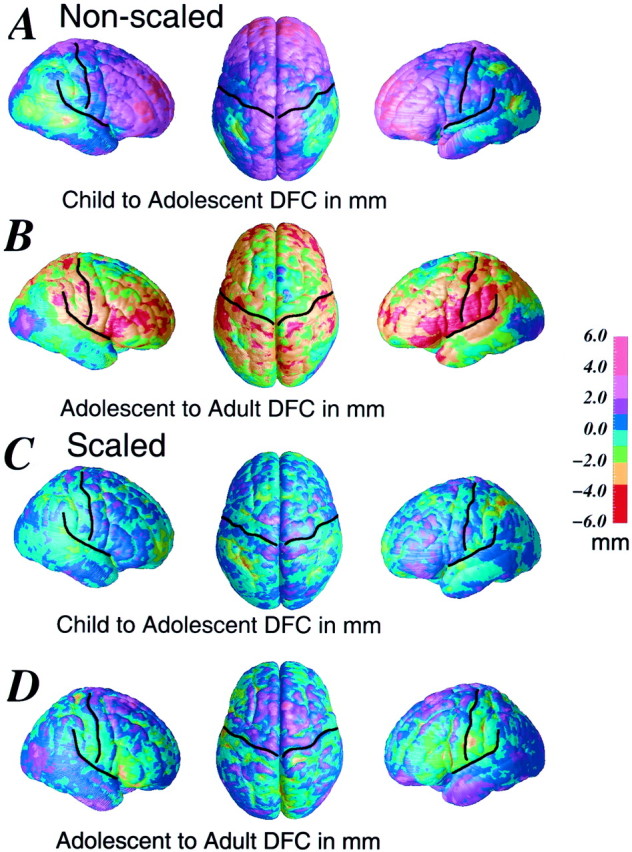
Recent in vivo structural imaging studies have shown spatial and temporal patterns of brain maturation between childhood, adolescence, and young adulthood that are generally consistent with postmortem studies of cellular maturational events such as increased myelination and synaptic pruning. In this study, we conducted detailed spatial and temporal analyses of growth and gray matter density at the cortical surface of the brain in a group of 35 normally developing children, adolescents, and young adults. To accomplish this, we used high-resolution magnetic resonance imaging and novel computational image analysis techniques. For the first time, in this report we have mapped the continued postadolescent brain growth that occurs primarily in the dorsal aspects of the frontal lobe bilaterally and in the posterior temporo-occipital junction bilaterally. Notably, maps of the spatial distribution of postadolescent cortical gray matter density reduction are highly consistent with maps of the spatial distribution of postadolescent brain growth, showing an inverse relationship between cortical gray matter density reduction and brain growth primarily in the superior frontal regions that control executive cognitive functioning. Inverse relationships are not as robust in the posterior temporo-occipital junction where gray matter density reduction is much less prominent despite late brain growth in these regions between adolescence and adulthood. Overall brain growth is not significant between childhood and adolescence, but close spatial relationships between gray matter density reduction and brain growth are observed in the dorsal parietal and frontal cortex. These results suggest that progressive cellular maturational events, such as increased myelination, may play as prominent a role during the postadolescent years as regressive events, such as synaptic pruning, in determining the ultimate density of mature frontal lobe cortical gray matter.
Figures
Similar articles
-
Mapping cortical asymmetry and complexity patterns in normal children.Psychiatry Res. 2001 Jul 1;107(1):29-43. doi: 10.1016/s0925-4927(01)00091-9. Psychiatry Res. 2001. PMID: 11472862
-
Localizing gray matter deficits in late-onset depression using computational cortical pattern matching methods.Am J Psychiatry. 2004 Nov;161(11):2091-9. doi: 10.1176/appi.ajp.161.11.2091. Am J Psychiatry. 2004. PMID: 15514411
-
Mapping sulcal pattern asymmetry and local cortical surface gray matter distribution in vivo: maturation in perisylvian cortices.Cereb Cortex. 2002 Jan;12(1):17-26. doi: 10.1093/cercor/12.1.17. Cereb Cortex. 2002. PMID: 11734529 Clinical Trial.
-
Anatomic magnetic resonance imaging of the developing child and adolescent brain and effects of genetic variation.Neuropsychol Rev. 2010 Dec;20(4):349-61. doi: 10.1007/s11065-010-9151-9. Epub 2010 Nov 11. Neuropsychol Rev. 2010. PMID: 21069466 Free PMC article. Review.
-
Brain structural and functional changes in adolescents with psychiatric disorders.Int J Adolesc Med Health. 2013;25(3):245-56. doi: 10.1515/ijamh-2013-0058. Int J Adolesc Med Health. 2013. PMID: 23828425 Free PMC article. Review.
Cited by
-
Surviving genocide in Srebrenica during the early childhood and adolescent personality.Croat Med J. 2013 Feb;54(1):55-64. doi: 10.3325/cmj.2013.54.55. Croat Med J. 2013. PMID: 23444247 Free PMC article.
-
Training the developing brain: a neurocognitive perspective.Front Hum Neurosci. 2012 Apr 9;6:76. doi: 10.3389/fnhum.2012.00076. eCollection 2012. Front Hum Neurosci. 2012. PMID: 22509161 Free PMC article.
-
Brain development in heavy-drinking adolescents.Am J Psychiatry. 2015 Jun;172(6):531-42. doi: 10.1176/appi.ajp.2015.14101249. Epub 2015 May 18. Am J Psychiatry. 2015. PMID: 25982660 Free PMC article.
-
Development of the motivational system during adolescence, and its sensitivity to disruption by nicotine.Dev Cogn Neurosci. 2011 Oct;1(4):430-43. doi: 10.1016/j.dcn.2011.05.010. Epub 2011 Jun 6. Dev Cogn Neurosci. 2011. PMID: 22436565 Free PMC article. Review.
-
Working memory performance among childhood brain tumor survivors.J Int Neuropsychol Soc. 2012 Nov;18(6):996-1005. doi: 10.1017/S1355617712000793. Epub 2012 Jun 13. J Int Neuropsychol Soc. 2012. PMID: 22691544 Free PMC article.
References
-
- Barkovich AJ, Kjos BO, Jackson DE, Jr, Norman D. Normal maturation of the neonatal and infant brain: MR imaging at 1.5 T. Radiology. 1988;166:173–180. - PubMed
-
- Benes FM, Turtle M, Khan Y, Farol P. Myelination of a key relay zone in the hippocampal formation occurs in the human brain during childhood, adolescence, and adulthood. Arch Gen Psychiatry. 1994;51:477–484. - PubMed
-
- Cohen J, Cohen P. Applied multiple regression analysis for the behavioral sciences, Ed 2. Erlbaum; London: 1983.
-
- Diamond MC. Response of the brain to enrichment. An Acad Bras Cienc. 2001;73:211–220. - PubMed
-
- Duvernoy HM, Cabanis EA, Vannson JL. The human brain: surface, three-dimensional sectional anatomy and MRI. Springer; Vienna: 1991.
Publication types
MeSH terms
Grants and funding
LinkOut - more resources
Full Text Sources
Medical